
In this segment, I’ll look at how publishers fared in the first quarter. The figure below shows the treemap for publisher performance in units sold versus the same period last year. As you can see, the market as a whole grew about 7%. The top-performing publisher in terms of increased unit sales was the Pragmatic Programmers, with 294% growth, followed by APress’ Friends of Ed imprint, up 235%, and Thomson’s Course Technology unit, up 230%. Among the “majors” (Pearson, Wiley, O’Reilly, Microsoft, and McGraw Hill), only Wiley and O’Reilly outperformed the market. (Click on the image below to pop up an enlarged version.)
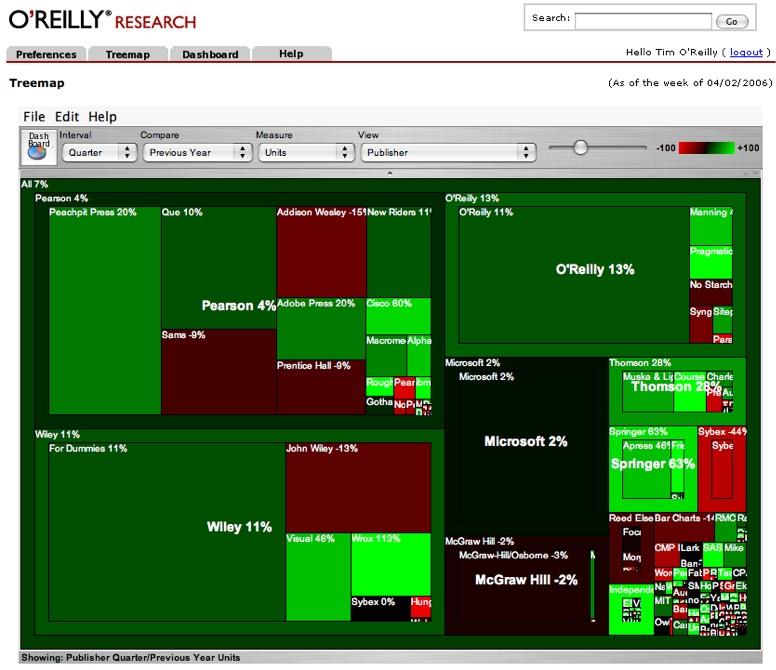
Pearson, the largest computer book publishing conglomerate, was up 4%, helped mostly by strong performance at Peachpit (up 18%), Adobe Press (up 19%), Macromedia Press (up 27%) and Cisco Press (up 62%). Wiley was up 11% overall, with Wrox (up 116%) and Visual (up 46%) leading their growth. O’Reilly was up 13% overall, including distribution clients (we distribute the Pragmatic Programmers, Manning, No Starch, Sitepoint, Syngress and Paraglyph) and 11% in its own publishing program. Microsoft Press was up only 2%, while McGraw-Hill continued its decline, off another 2%.
As Gary Cornell of APress pointed out when I saw him at Microsoft’s Mix06, his strong growth rate coupled with Addison-Wesley’s lackluster one puts APress on track to be larger than Addison-Wesley by year end, which would make him #2 after O’Reilly in professional computer book publishing. However, the competitor we have our closest eye on is Wrox, which is resurgent under new management at Wiley. (Of course, it helps that we’re partnering with Pragmatic, Manning, and some of the other up-and-comers :-) Wiley picked up Wrox’s top 35 titles when it went out of business, and Gary Cornell picked up the rest at APress. Wiley’s strong performance with these titles (and new ones they’ve added since) shows how smart they were to cherry pick the list. While APress’ growth has largely been driven by the publication of large numbers of titles (funded by APress’ parent and distributor, Springer Verlag), Wrox is getting a lot of bang from each title, with average revenue per title in Q1 of over $19,000, vs. about $13,000 per title at APress.
That being said, Apress is getting a good rep among our “alpha geek” audience. One long-time friend wrote to me: “The Apress books are starting to appear on programmer bookshelves in droves (including mine), and Apress is getting a rep around the guys who work for me as an imprint you can buy sight unseen. Wrox won’t ever get that rep back, if it ever had it. (The only other publishers I do that with are Tor and you….)”
A couple of other notes: (1) Peachpit’s strong performance is somewhat deceptive, since 14% of its entire sales this quarter came from a single new title, Scott Kelby’s phenomenally successful iPod Book, which sold nearly 30,000 copies via Bookscan-reporting stores in the quarter. (2) Of the top 50 titles, Wiley had 17, Pearson had 13, O’Reilly had 10, Microsoft had 8, and McGraw Hill had 2. No other publisher had more than 1.
Publisher Dashboards
In our data warehouse, the treemap is an interface to a series of data dashboards that allow us to drill down through the various dimensions, reaching title-level detail in only three clicks. We can also use this dashboard functionality to look at publisher market share and performance. The figure below shows a portion of the publisher data dashboard.
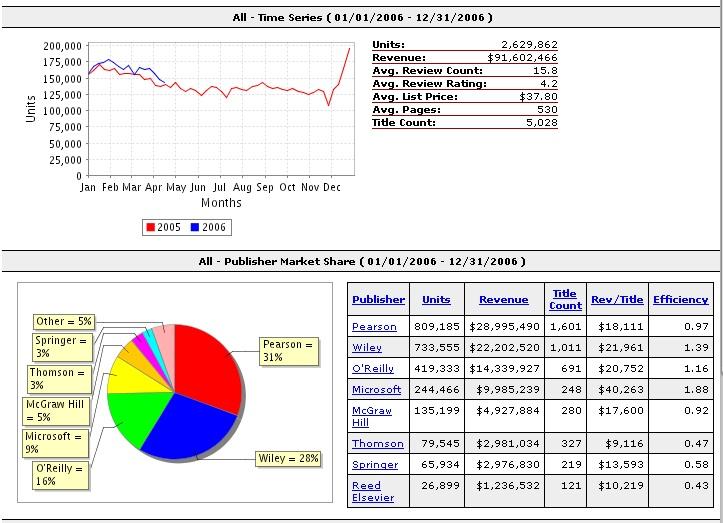
The trend chart at the top shows the year-on-year trend for the entire market, which I discussed in a previous posting.
The pie chart shows publisher market share across the entire industry. Pearson (including Addison-Wesley, Prentice-Hall, Cisco Press, Sams, Que, Peachpit, Adobe Press, Cisco Press, and Macromedia Press among other imprints) is the largest player, with 31% market share, followed by Wiley (including the Wiley, For Dummies, Wrox, and Sybex imprints) with 28%, O’Reilly (including distribution clients such as the Pragmatic Programmers, Manning, and No Starch), with 16%, Microsoft with 9%, McGraw-Hill with 5%, and Thomson and Springer (APress) with 3%.
The table to the left of the pie chart shows the actual unit sales reported by Bookscan, plus a dollar value calculated by multiplying the units by the retail price of each book. Keep in mind that this is not the actual dollar value (or total unit sales) for each publisher. Bookscan reports perhaps 70% of US book sales, or about 50% of worldwide English-language book sales. Books are typically sold at a discount to the bookstore, with the discount depending on the type of book. Most consumer-oriented books are sold to retailers at a 50% or greater discount, while some professional books are sold at a discount of either 32 or 37%. These two factors offset each other, so the reported revenue is likely in the ballpark, but it’s nowhere near exact. It also doesn’t take into account other non-bookstore channels of distribution.
The title count shown is not the total title count of the publisher in question. It is the title count of books in the category that had at least one sale reported via Bookscan during the quarter. A publisher may have additional books in print that had no Bookscan sales during the period.
Perhaps the most interesting figures for would-be authors are the Revenue/Title and Efficiency fields. As you can see, the revenue per title varies wildly, with Microsoft Press delivering nearly twice the revenue per title of any other publisher. This is because of the very high price of some of their reference sets, which can be in excess of $200. But those books also sell very well! Microsoft also does very well with some of its low-priced, high-volume series like Step-by-Step, leading to an average revenue per title for the quarter of over $40,000. Wiley and O’Reilly are clustered at about $21,000, with Pearson and McGraw-Hill around $18,000, and with Springer (APress), Thomson, and Reed Elsevier trailing far behind.
The efficiency field shows the percentage of the total units sold divided by the percentage of the total title count. A title efficiency value higher than one means that that publisher’s titles exceed industry averages in unit sales performance, while a value below one means that publisher’s titles are below industry averages. Again, Microsoft Press is far and away the top performer against this metric, followed by Wiley (For Dummies) and O’Reilly. These are the only three major publishers with a title efficiency higher than one. (Several of O’Reilly’s distribution clients who are too small to be shown at this level of detail, notably Manning and the Pragmatic Programmers, also have high title efficiency.)
Another way to view this efficiency value is to see it as the number of titles a publisher needs to publish in order to achieve a certain level of sales. So, for example, while APress and Thomson showed high growth, they did it by publishing many more titles, not by publishing titles that, on the whole, performed exceptionally well. (This is not to say that they don’t have any bestsellers, just that their overall program is less efficient than those of competitors.) Manning and Pragmatic, on the other hand, had strong growth as a result of high title efficiency, as did Wiley’s Wrox imprint.
Here’s how publishers fared by category. (See yesterday’s post for a description of the major categories.)
Systems and Programming
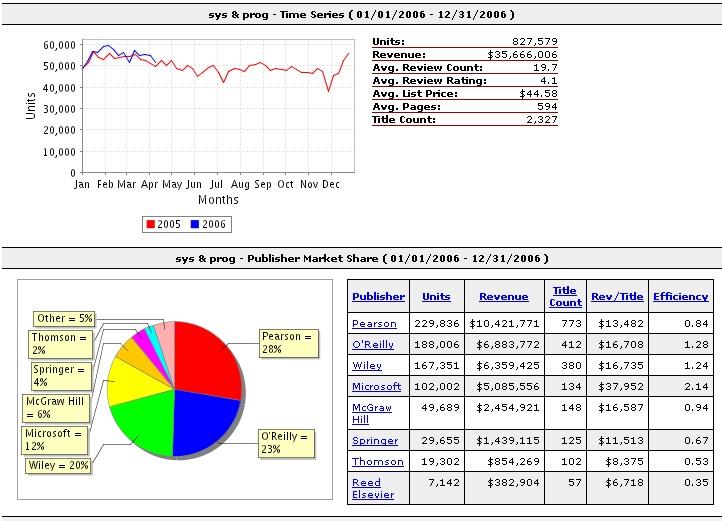
The trend chart at the top shows the year-on-year trend for this category only. As you can see, this category is only marginally ahead of last year.
The pie chart shows publisher market share for this category. Pearson (including Addison-Wesley, Prentice-Hall, Cisco Press, Sams, Que, among other imprints) is the largest player in the professional programming and administration space with 28% market share, followed by O’Reilly (including distribution clients such as the Pragmatic Programmers, Manning, and No Starch), with 23%, Wiley (Dummies, Wrox, and Sybex) with 20%, Microsoft with 12%, McGraw-Hill with 6%, and Springer (APress) with 4%. Microsoft Press has far and away the highest title efficiency in the professional programming category, followed by O’Reilly and Wiley.
Web Design and Development

As you can see, the Web Design and Development category is trending well above last year. Pearson is the largest publisher in the category, with 37% share, followed by Wiley with 24%, and O’Reilly with 22%. Springer (APress and Friends of Ed) is tied for fourth place with Microsoft, with 6% apiece.
O’Reilly delivered the highest revenue per title, followed closely by Microsoft. Microsoft and O’Reilly are also tied for first place in title efficiency. Pearson is also above average in efficiency, with APress, McGraw-Hill and Thomson trailing badly.
Digital Media Applications
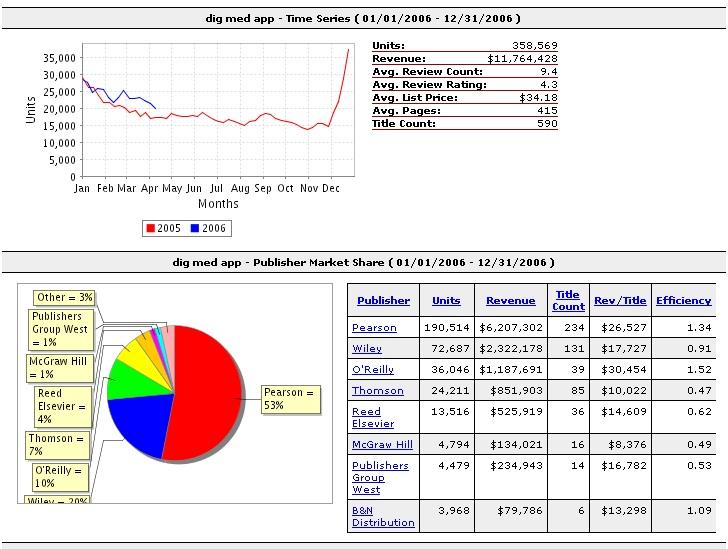
The digital media category is growing strongly year over year. On the trend graph, note the size of the holiday spike, which dwarfs that for professional publishing areas like Systems and Programming or Web Design and Development.
Pearson, with its Peachpit, Adobe Press, and Macromedia Press imprints, is far and away the gorilla in the digital media category, with 53% market share, followed by Wiley at 20% and O’Reilly at 10%. Thomson, growing fast in this space, is now at 7% share. But we’re pleased to see that O’Reilly is the most efficient publisher, as entering this category was a strategic departure from our core programming and web development categories. As an illustration of how title efficiency works, you can see that we’ve achieved 50% of the unit sales of Wiley with only 29% of their number of titles, and 50% more unit sales than Thomson with fewer than half as many titles.
Our strength in this area is driven by the success of titles such as Photoshop CS 2 One on One, Photoshop Elements 4: The Missing Manual, iPhoto 6: The Missing Manual and The Photoshop Photo Effects Cookbook.
Consumer Operating Systems and Devices
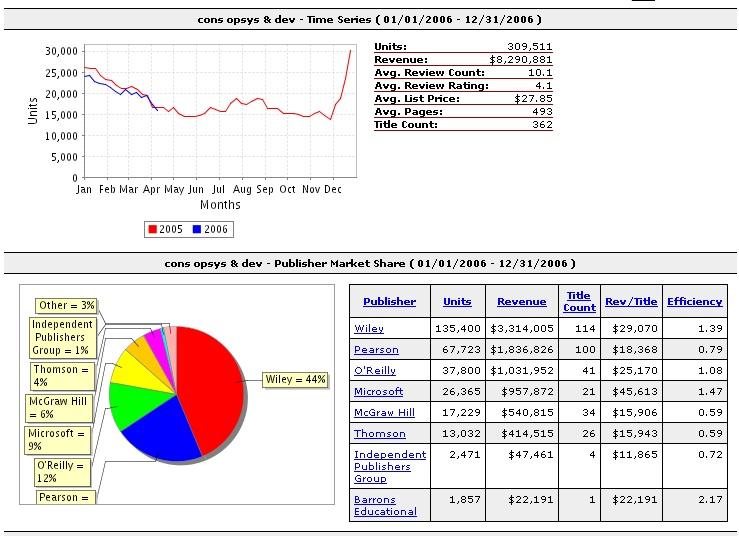
Wiley, with its For Dummies line, remains the dominant publisher in the shrinking category of books on consumer operating systems, with a 44% share. Pearson has 22%, O’Reilly 12%, and Microsoft 9%. Again, only Microsoft, Wiley, and O’Reilly have a title efficiency value greater than one.
Once again, note the very strong holiday spike in this category.
Business Applications
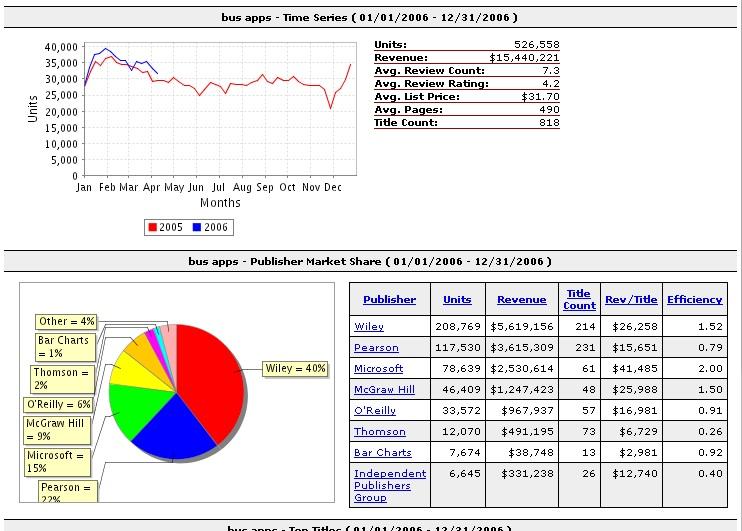
In business applications, Wiley is again the dominant player, with 40% market share, followed by Pearson at 22%, Microsoft at 15%, McGraw-Hill at 9%, and O’Reilly at 6%. In this category, Microsoft, Wiley, and McGraw-Hill all have strong title efficiency. It’s the only major category where we haven’t quite been able to outperform at O’Reilly. Despite the success of books like Quickbooks: The Missing Manual or Excel Hacks, this is not an area we’ve mastered! Microsoft Press and McGraw-Hill benefit from their strong position as “official” publishers, Microsoft for their own software, and McGraw for companies such as Intuit and eBay. Wiley of course does well in this space because of the dominant For Dummies brand.
Next week: Bestseller Lists