
Last fall, I came to the defense of Google against lawsuits by the Author’s Guild and Association of American Publishers, arguing that Google Book Search would help readers to rediscover works that were no longer commercially available. I pointed out, in fact, that only about 4% of all titles ever published are still being commercially exploited. (Kevin Kelly wrote a long report on the current state of book scanning initiatives in yesterday’s New York Times Magazine.)
A recent study by Roger Magoulas and Ben Lorica of O’Reilly Research provided strong data to support the assertion that online access drives usage of content that is generally not available in print. We compared sales reported through Nielsen Bookscan for the fourth quarter of 2005 with access logs from both O’Reilly’s Safari Books Online service and from Google Book Search. The result provides compelling support for Chris Anderson’s “long tail” theory.
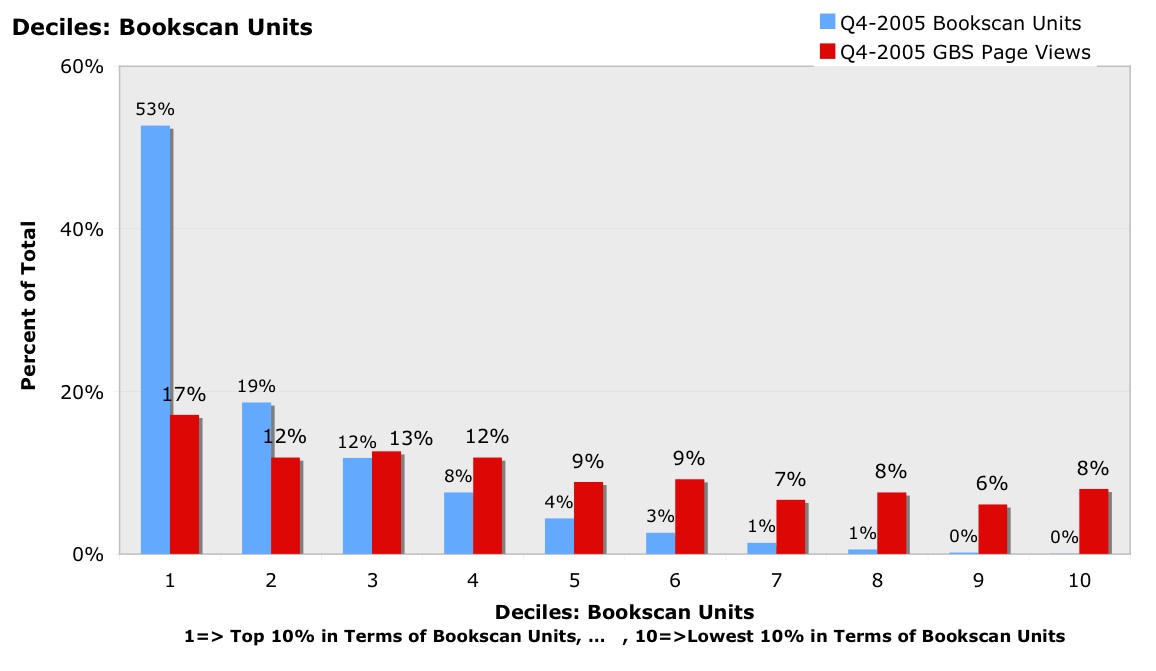
The methodology we used was to divide the titles in the Bookscan top 10,000 into deciles. We then plotted the number of Safari views for the books in each decile. As you can see from the graph below, the top 10% of print titles delivered 53% of all unit sales. Those same titles provided 25% of Safari page views. By the second 10% of print titles, the relative level of access is very close, at 19% and 18% respectively, and by the third decile, there is a greater percentage of Safari page views for the titles than the percentage of books sold. Out at the end of the tail, you can see substantial Safari usage of books that for all practical purposes didn’t sell any copies in print. (Titles in the lowest deciles may have sold only a single copy during the period in question, rounding to zero.) Fully 7% of page views in Safari is for books that are not selling at all in print; 20% of access is to books generating only 5% in print book sales; and 29% is to books generating only 9% of print book sales.
You can see how steep the print sales graph is, and how much flatter the online access graph is. Note how the Safari graph actually rises out at the end of the tail.

With Google Book Search, which has even older books (Safari includes only books going back to 2000), the effect is even more striking. 27% of page views come from books generating only 2% of unit sales, and fully 47% come from books generating only 9% of unit sales!
We believe that one reason that the Google Book Search graph is even flatter than the Safari graph is that it represents raw, unprompted search activity. Safari announces new titles when people first login to the service, and this marketing drives up the percentage of access to the most popular titles. With the “Safari Enabled” program, people are also able to use Safari for access to books that they’ve already bought in print.
Roger wrote: “[Note] the sharp contrast between the way computer books are distributed on BookScan – with a great concentration in the first two deciles of 72% of sales (pretty darn close to Pareto 80/20) – and the way access is distributed for users of Google Book Search (GBS) – a relatively even distribution with far less concentration in the top BookScan deciles and an uptick in the lowest BookScan decile. Take out availability, distribution and inventory considerations and GBS shows a more equitable distribution of interest across computer book titles – the rattlesnake tail.”
Roger’s mention of “the rattlesnake tail” is a reference to an earlier study done by Andrew Odewahn comparing Safari usage to Bookscan sales. The graph that Andrew produced showed a curious spike in usage out at the end of the tail. You can see why we called this effect the rattlesnake tail:
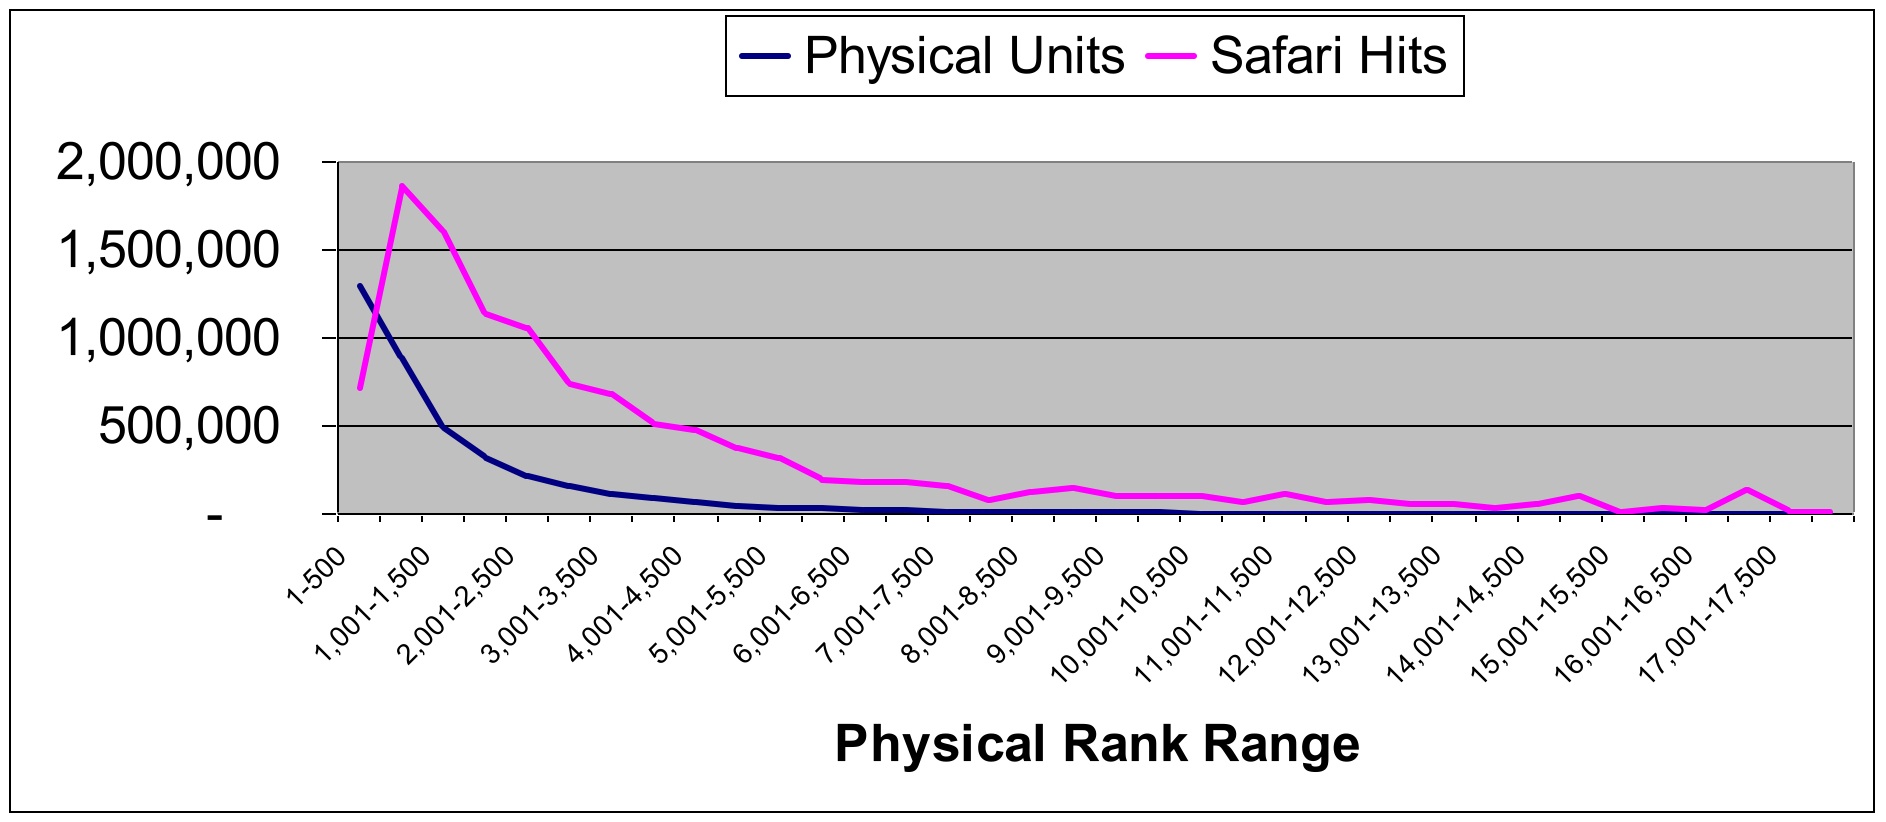
Rather than dividing the titles into deciles, Andrew used groups of 500 titles. And even though the study is based on the Bookscan Top 10,000 computer books report, you’ll notice that the graph shows 17,500 titles. The reason is that during the period of the study, the first 6 months of 2005, 17,754 distinct SKUs (ISBN’s) appeared in the report at least once. Andrew ranked the 17,754 books by total unit sales and divided them into blocks of 500 based on their unit sales. He then measured the Safari page views for the books in each block.
The rattlesnake tail became even more pronounced when Andrew plotted the average weekly unit sales against the average weekly Safari page views for each title:
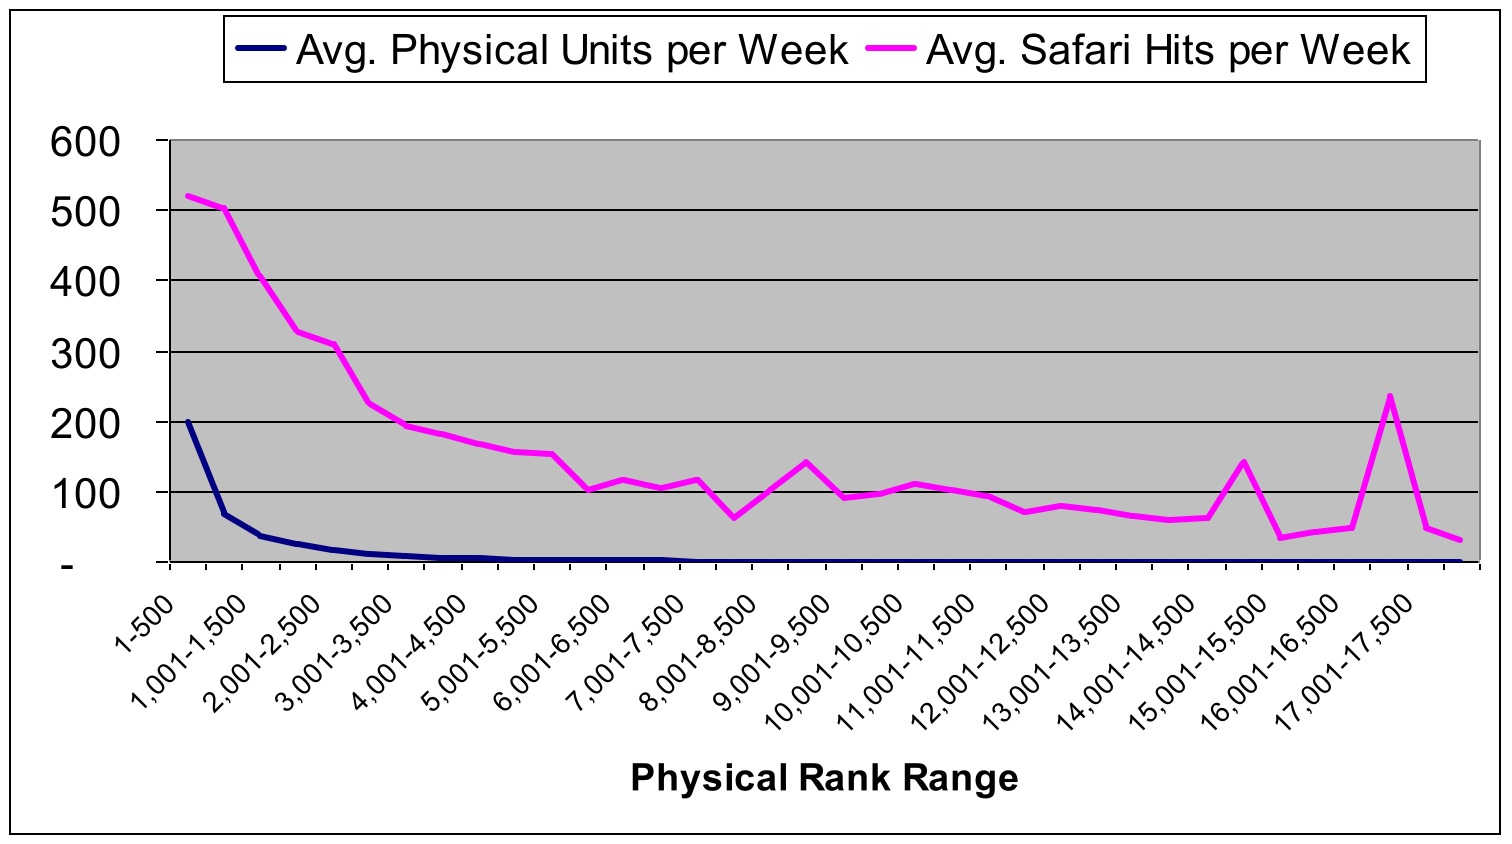
We determined that some of the rattlesnake spike was the result of user error — people might, for example, use an older edition of a book for which a newer version was available. But a significant percentage of that usage was for old books for which no newer version was available. (You can guess that we’ll soon be bringing back older books for download sales or print-on-demand!)
Using a Bookscan rank of 4,500 as a cutoff, Andrew also computed rough estimates for the long tail effect using proportions of unit sales and views:
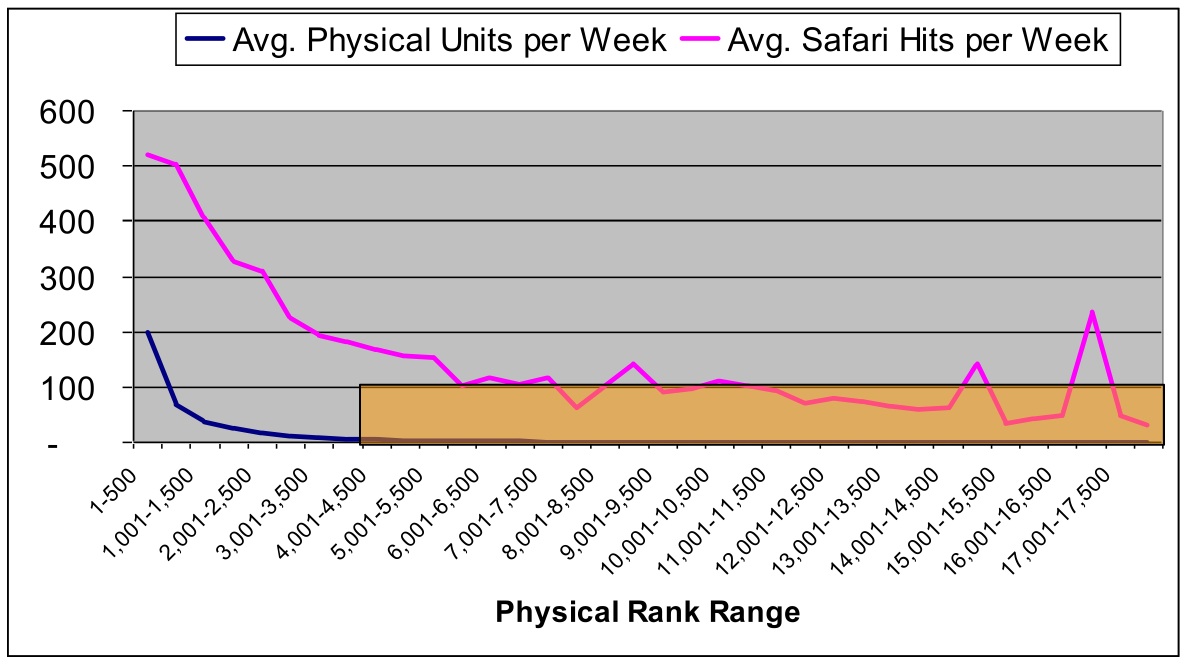
A Bookscan rank of 4500 to mark the start of the long tail is quite generous. At that level, a book is selling only a few copies a week nationwide. Just eyeballing the graph, you’d put the long tail cutoff at perhaps 3000! But even setting the bar at 4500, Andrew concluded that 23% of Safari views came from 6% of physical book sales.
While my support for Google against the AAP was driven primarily by the considerations that I outlined in the articles I linked to at the start of this piece, Andrew’s study gave me hard data that supported my reasoning. Roger and Ben’s more recent work has confirmed it. There is significant demand for books that are generally unavailable in print.
Notes on data sources and methodology
As described in previous Radar postings, our Bookscan data mart contains weekly point-of-sale data on the top 10,000 computer books aggregated by Nielsen from retailers such as Barnes & Noble, Amazon, Borders, and major independent booksellers. The Safari data is for O’Reilly and Pearson books only (plus a few other publishing partners who have only some of their books in Safari). For example, of the 17,754 physical ISBNs in Andrew’s study, 2,171 were available through Safari. The Google Book Search data is for O’Reilly books only, a total of 683 titles.
We don’t have access to other publishers’ data, but would be interested to do a similar analysis given access to that data. We would be particularly interested in working with publishers outside the technical books area.