
O’Reilly editor Brian Sawyer pointed to an interesting observation over at kottke.org: “If I were Apple, I’d be worried about this. Two lifelong Mac fans are switching away from Macs to PCs running Ubuntu Linux: first it was Mark Pilgrim and now Cory Doctorow. Nerds are a small demographic, but they can also be the canary in the coal mine with stuff like this.” Here’s Mark’s post. And here’s Cory’s. And it looks like Paul Bausch might not be far behind. Good timing for Ubuntu Hacks, although we might also want to take a leaf from David Pogue’s book, and do a Switching to Ubuntu as well :-) Brian Jepson added to the editors’ list thread: “I’ve been hearing these rumblings as well, but I don’t know what to make of them. One of my friends just told me that all this switching away buzz has convinced him to decide against switching to Mac OS X, and he’s going to move from Windows to Ubuntu instead.”
But never mind Apple looking over its shoulder. How about Red Hat? Interest in Ubuntu is remarkably high. Take a look at the O’Reilly Research – Yahoo! Buzz Market:
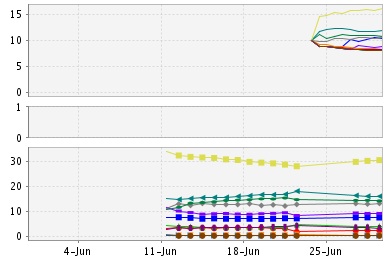
Ubuntu garners nearly 30% of Linux searches on Yahoo! vs only about 14% for Red Hat, and only about 2% for Fedora, and the prediction market shows a stock price of $16.15 for Ubuntu, $10.97 for Red Hat, and $8 for Fedora.
(For more background on the buzz market, see the about page. (There’s also an IEEE paper describing the Yahoo! buzz market’s methodology, but it’s a pdf behind a member firewall.) Briefly, though, Yahoo!’s goal with the game is to see whether a futures market can predict search volume, and O’Reilly’s is to see whether search volume can predict broader tech trends. Participants buy and sell stocks corresponding to a basket of search terms, which are then ranked against the actual percentage of search volume in the related stocks in that specific market. The graph above has three parts. The top part shows the stock price trend, the middle block shows absolute spikes in search volume, and the bottom shows the percentage trend in search volume. There is also an invidividual page for each stock in the market, which allows you to buy and sell that stock, but also contains a link showing the search terms that are aggregated to make up that stock.)
P.S. The reason the graphs start about June 11 is that we recently did a refresh, introducing new markets on that date.