
As I try to do each quarter, here’s a report on the state of the
computer book market, as revealed by data from Nielsen Bookscan’s top
3,000 Computer Books report. (See my entry
Book Sales as a Technology Trend Indicator for a description
of our methodology.)
Here’s the year-on-year trend since 2003:
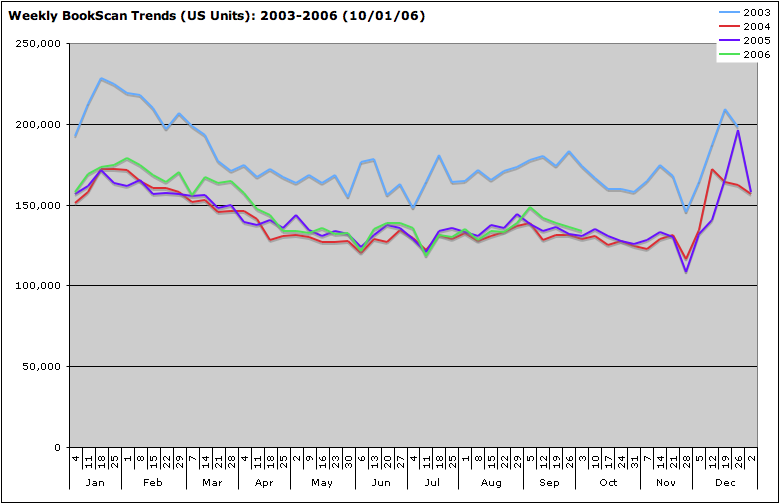
There’s little to say about this picture that will cheer up
computer book publishers or authors. The market
continues to bump around at about the same level as it has for
the past three years. Some publishers express hope that the
release of Microsoft Vista and the next release of Office will
boost results going into next year, but so far, no new technology
release has been able to move the needle for long. We suspect
that the combination of increasingly sophisticated online
information, easier to use Web 2.0 applications, and customer
fatigue with new features of overly complex applications,
combined with the consolidation of the retail book market,
mean that the market will never return to its pre-2000 highs,
despite new enthusiasm for Web 2.0 and the technology market
in general. In addition, new distribution channels (including downloadable PDFs) are growing up as retailers allocate less space to computer books.
That being said, there’s no question that Vista, the new release of Microsoft Office (and the next release of Mac OS X) will have a big impact late in the fourth quarter and going into the first quarter of next year.
I continue to be amazed by the regularity of the year-on-year pattern in the data. The calendar trumps new technologies, new books, and the press of world events. Week by week, the same ups and downs seem to recur. December (holiday purchases) and January (exchanges and New Year’s resolutions) drive spikes, while July 4 and Thanksgiving create seasonal lows, with other factors driving other recurring bumps and troughs. We like to think we’re creatures of choice and will, but any measure of behavior in the aggregate shows how much we respond to the same external triggers.
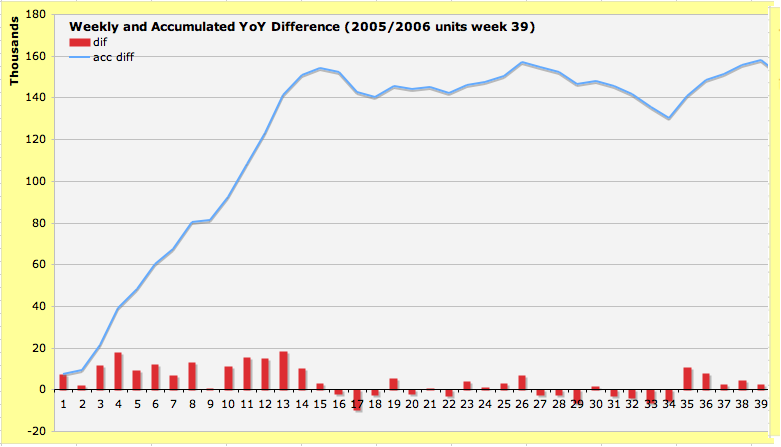
Year on Year Gains Level Off After Q1
As previously reported, the year got off to a strong start, with about 140,000 more units sold in the first quarter than in the first quarter of 2005. Q2 was only up marginally, about 16,000 units above the same quarter in the prior year. Q3 was up only a thousand units. You can see this trend in the figure below, with one line showing the accumulated difference year on year, and the bars at the bottom showing whether each week was above or below the corresponding week in the prior year:
The average price of a computer book increased from $38.02 in 2005 to $38.61 in 2006.
Small Print: Understanding the Numbers
While I’ve written about this previously, I need to repeat my reminder that
Nielsen figures do not represent the entire computer book market.
However, they represent a large enough sample to be
representative for most categories. Nielsen claims to report 65-70% of US
bookstores; the US represents about 70% of the total
English-language market. Accordingly, these figures represent
perhaps 50% of the total market. I should also remind you that these figures represent
sell-through — that is, books that have actually been
sold by bookstores. On royalty statements, publishers report
sell-in — that is, books that have been sold to
bookstores, but which may be returned after sitting on the
shelves for a while.
Further, revenue figures shown
in these reports are calculated based on unit sales times retail
price of each book. However, because books are typically sold
at a discount of more than 50% to retailers, while Nielsen is
reporting on only 50% of the market, these two figures offset
each other, and we’ve found that the resulting revenue figures
are within spitting distance of actual publisher and total market
figures.
Next up: Details on winners and losers by category.