
WeatherSpark is tapping into a variety of datasets to deliver a different level of weather engagement. The new website, which provides data from more than 4,000 weather stations, lets you interact with full-screen weather graphs to investigate current forecasts and historical weather patterns.
In the interview below, I talk with WeatherSpark co-founder Jacob Norda (@jacobnorda) about his company’s approach to weather data and visualizations.
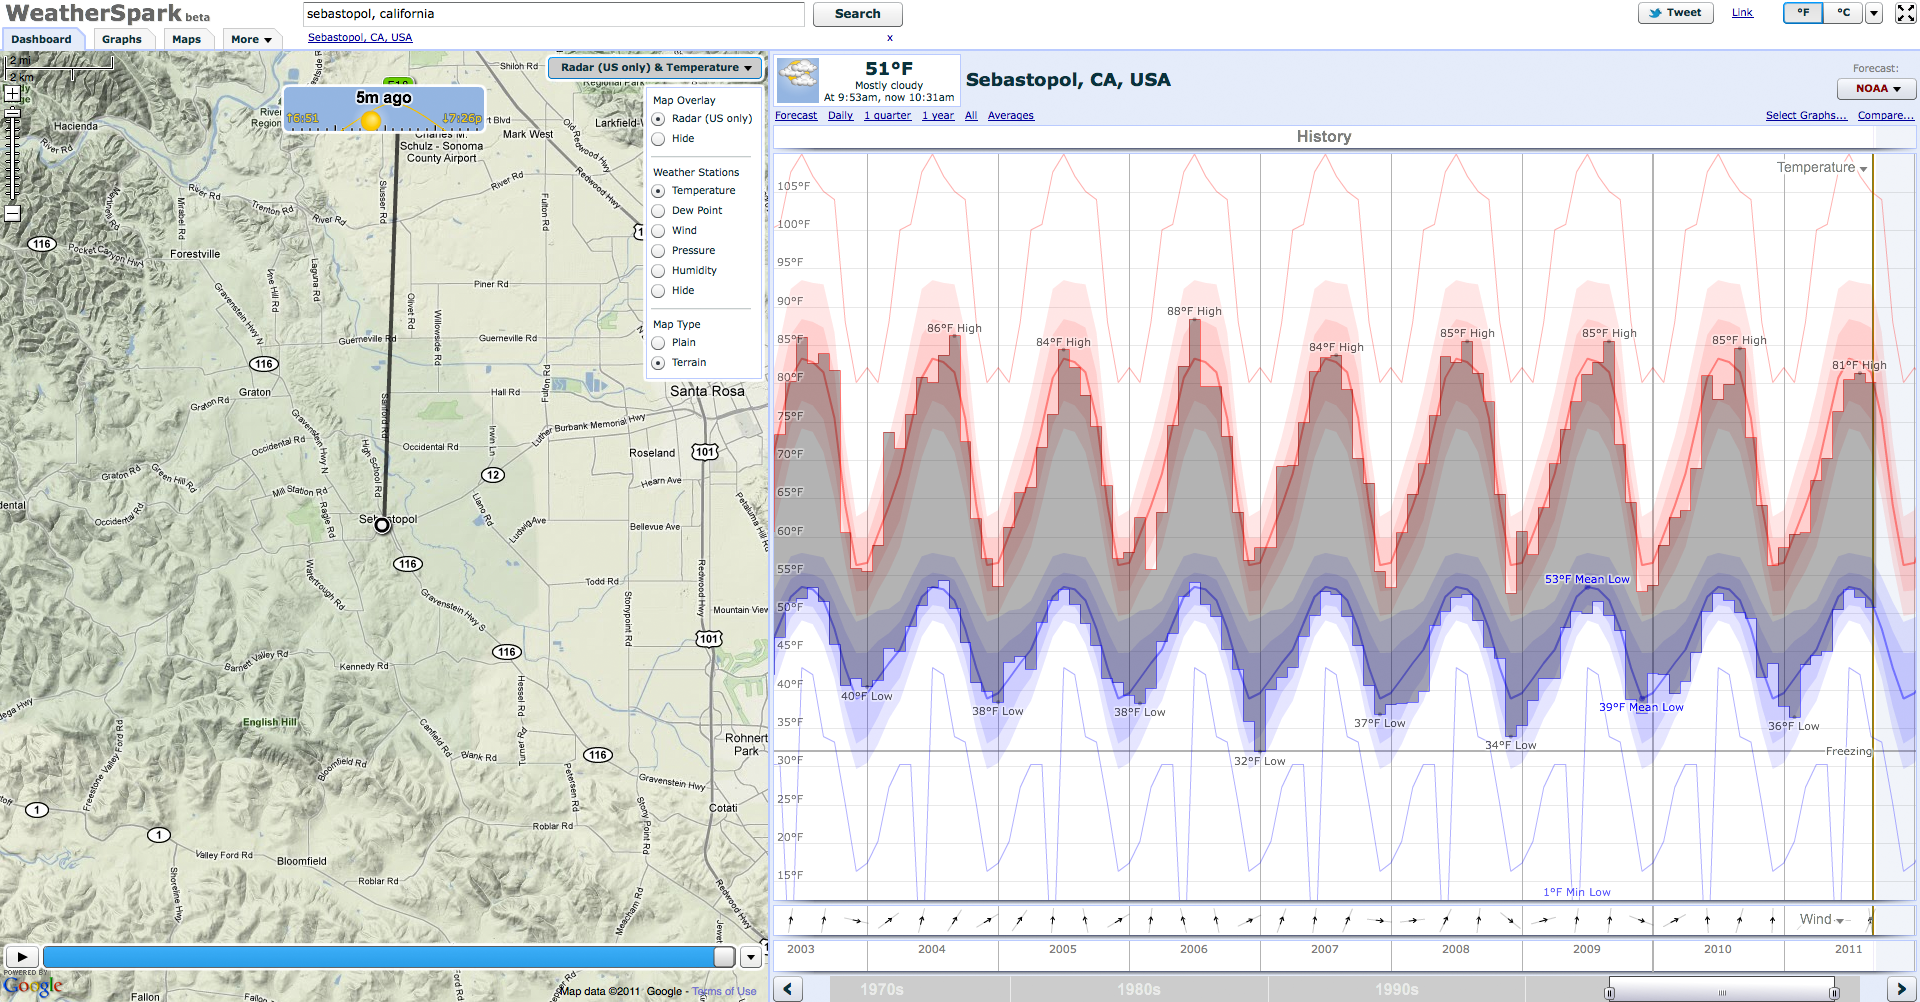
In addition to forecast information (left), WeatherSpark also offers access to historical trend data (right). (Click to enlarge.)
What problems with traditional weather information are you trying to solve?
Jacob Norda: Most weather websites present weather data using tables with numbers and icons, and they show maps in very small viewports. This makes it hard to get an overview, and it typically requires a lot of page views to find the relevant information.
We wanted to address these shortcomings by using an integrated dashboard with a powerful map and graph view. This allows for an overall weather impression — “it’s raining nearby,” “today will be a hot/cold day” — the ability to look for very specific information — “It’ll be 70F at 2pm” — as well as an intuitive way to get to historical weather and average weather information, which is not readily available.
We decided to show the historical information because we think it’s interesting. People oftentimes say things like, “last summer was unusually hot/cold/wet,” and we wanted to provide a way to actually look that up. That information also powers the averages, which we had to have, so it would have been a missed opportunity to not make it available.
In addition, technical restrictions make it so other websites can only show radar animations over very short periods of time, typically two hours. We’ve solved these technical issues, and that means we can offer full-screen radar playback spanning several days. That allows for things like radar animations of hurricanes.
Where does WeatherSpark get its data?
Jacob Norda: We get the forecasts from a number of sources, including the National Oceanic and Atmospheric Administration (NOAA), the Norwegian Meteorological Institute, World Weather Online, and Weather Central. The sources are noted on the about page. The historical data comes from a number of governmental and non-governmental data sources, primarily NOAA.
How can weather data be improved?
Jacob Norda: There’s a wild variety in file formats, both for historical and forecast information. The information would be more easily used if this data were somehow unified. However, removing old formats or APIs would break legacy systems, so we don’t envision the current sources doing that. We’re considering offering a unified API, but it’s in the pre-roadmap stage at this point.
This interview was edited and condensed.
 Strata Conference New York 2011, being held Sept. 22-23, covers the latest and best tools and technologies for data science — from gathering, cleaning, analyzing, and storing data to communicating data intelligence effectively.
Related: