
The German mathematician Lothar Collatz first proposed what’s now known as the Collatz conjecture in 1937. It says that you can repeatedly take any number n and divide it by two if the number is even, or multiply by three and add one if n is odd, and eventually, no matter what number you started with, the conjecture says you’ll get to 1.
The Collatz conjecture does remain just that — a conjecture. But one approach to proving it is to consider its reverse. In other words, rather than proving that all numbers lead to 1, prove that 1 leads to all natural numbers.
Toward that end, Jason Davies has created a visualization of the Collatz graph in reverse. It shows the orbits of all numbers with a length of 18 or less.
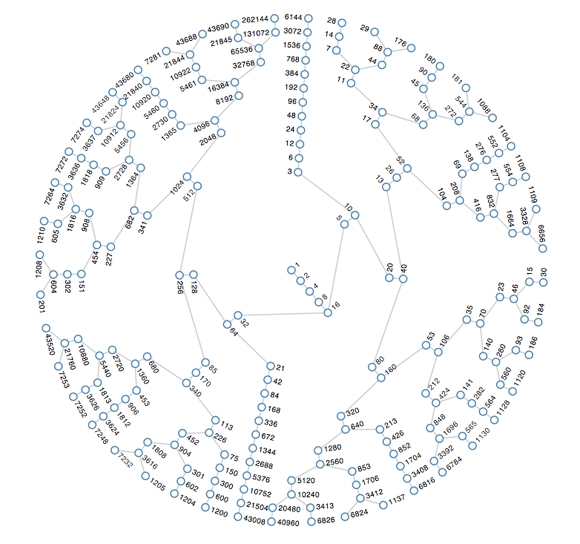
Visit his site to watch the graph grow.
Found a great visualization? Tell us about it
This post is part of an ongoing series exploring visualizations. We’re always looking for leads, so please drop a line if there’s a visualization you think we should know about.
 Web 2.0 Summit, being held October 17-19 in San Francisco, will examine “The Data Frame” — focusing on the impact of data in today’s networked economy.
More Visualizations: