
A new visualization by travel writer Osman Khan charts the “Evolution of Western Dance Music,” tracing music through time and space from Africa and the Caribbean through the development of the Blues, Jazz, Funk, Disco, and, well, you know the story.
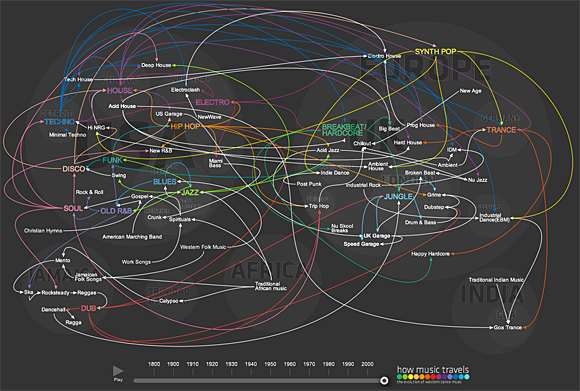
Screenshot of “The Evolution of Western Dance Music” visualization. Click here for the interactive version.
Khan recognizes the spread of music is open to debate — in terms of how you define genre and influence, for example. (I’d also add, in terms of the size you choose to depict the continents in the associated visualization.) Khan points to his sources: Bass Culture, Last Night A DJ Saved My Life, and The All Music Guide to Electronica, along with Wikipedia.
The data marketplace Infochimps (where I found the link to Khan’s visualization) asks an interesting question: How would a visualization about the spread of music based on something like Infochimps’ Million Song dataset — a dataset about sound and recording metadata — differ from a visualization, like Khan’s, based on stories?
Found a great visualization? Tell us about it
This post is part of an ongoing series exploring visualizations. We’re always looking for leads, so please drop a line if there’s a visualization you think we should know about.
 Strata 2012 — The 2012 Strata Conference, being held Feb. 28-March 1 in Santa Clara, Calif., will offer three full days of hands-on data training and information-rich sessions. Strata brings together the people, tools, and technologies you need to make data work.
More Visualizations: