
A portion of the Internet said “no” to SOPA (the Stop Online Piracy Act) and PIPA (the Protect IP Act) this week with a powerful campaign that involved many websites, including O’Reilly, “going dark” to protest the pending legislation.
The protests didn’t just involve the temporary shut-down of websites, however. People were voicing their opinions as well. According to Twitter, there were around 3.9 million tweets about SOPA on January 18, the day of the protest.
Fred Benenson has visualized a portion of those SOPA tweets on GigaPan. With the tool, you can view top SOPA-related tweets and their associated Twitter users.
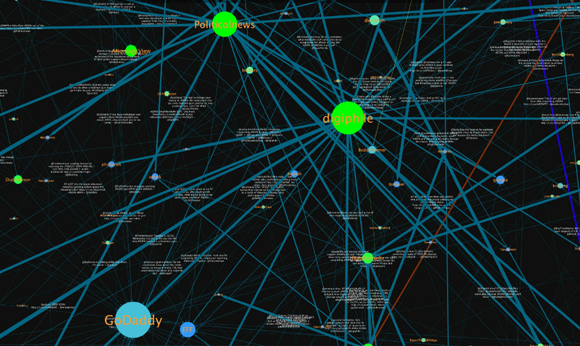 A small portion of Fred Benenson’s SOPA tweet visualization. See the larger version.
Check out the massive 32,000-pixel x 32,000-pixel version of the visualization here (be sure to view it in full-screen mode). Benenson has also put together a post that outlines the tools and process behind his work.
Found a great visualization? Tell us about it
This post is part of an ongoing series exploring visualizations. We’re always looking for leads, so please drop a line if there’s a visualization you think we should know about.
 Strata 2012 — The 2012 Strata Conference, being held Feb. 28-March 1 in Santa Clara, Calif., will offer three full days of hands-on data training and information-rich sessions. Strata brings together the people, tools, and technologies you need to make data work.
More Visualizations: