
Zebulon Young and I, web producers at O’Reilly Media, recently spent time focusing on the performance of the Velocity website. We were surprised by the results we achieved with a relatively small amount of effort. In two days we dropped Velocity’s page weight by 49% and reduced the total average U.S. load time by 3.5 seconds1. This is how we did it.
Velocity is about speed, right?
To set the stage, here’s the average load time for Velocity’s home page as measured2 by Keynote before our work:
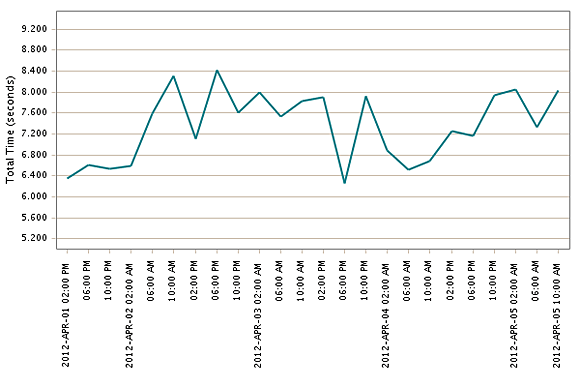
As the averages hovered above seven seconds, these load times definitely needed work. But where to start?
The big picture
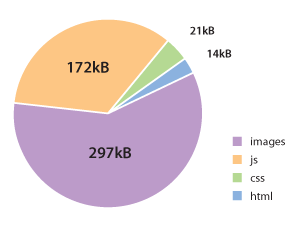
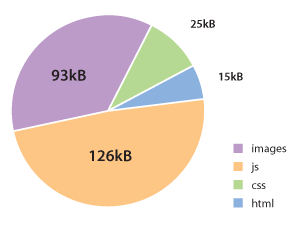
If you take a look at the raw numbers for Velocity, you’ll see that, while it’s a relatively simple page, there’s something much bigger behind the scenes. As measured3 above, the full page weight was 507 kB and there were 87 objects. This meant that the first time someone visited Velocity, their browser had to request and display a total of 87 pieces of HTML, images, CSS, and more — the whole of which totaled nearly half a megabyte:

Here’s a breakdown of the content types by size:
To top it off, a lot of these objects were still being served directly from our Santa Rosa, Calif. data center, instead of our Content Delivery Network (CDN). The problem with expecting every visitor to connect to our servers in California is simple: Not every visitor is near Santa Rosa. Velocity’s visitors are all over the globe, so proper use of a CDN means that remote visitors will be served objects much closer to the connection they are currently using. Proximity improves delivery.
Getting started
At this point, we had three simple goals to slim down Velocity:
- Move all static objects to the CDN
- Cut down total page weight (kilobytes)
- Minimize the number of objects
1) CDN relocation and image compression
Our first task was compressing images and relocating static objects to the CDN. Using Smush.it and the Google Page Speed lossless compression tools, we got to work crushing those image file sizes down.
To get a visual of the gains that we made, here are before and after waterfall charts from tests that we performed using webpagetest.org. Look at the download times for ubergizmo.jpg:


You can see that the total download time for that one image dropped from 2.5 seconds to 0.3 seconds. This is far from a scientific A/B comparison, so you won’t always see results this dramatic from CDN usage and compression, but we’re definitely on the right track.
2) Lazy loading images
When you’re trimming fat from your pages to improve load time, an obvious step is to only load what you need, and only load it when you need it. The Velocity website features a column of sponsor logos down the right-hand side of most pages. At the time of this writing, 48 images appear in that column, weighing in at 233 kB. However, only a fraction of those logos appear in even a large browser window without scrolling down.

We addressed the impact these images had on load time in two ways. First, we deferred the load of these images until after the rest of the page had rendered — allowing the core page content to take priority. Second, when we did load these images, we only loaded those that would be visible in the current viewport. Additional logos are then loaded as they are scrolled into view.
These actions were accomplished by replacing the <img> tags in the HTML rendered by the server with text and meta-data that is then acted upon by JavaScript after the page loads. The code, which has room for additional enhancements, can be downloaded from GitHub.
The result of this enhancement was the removal of 48 requests and a full 233 kB from the initial page load, just for the sponsor images4. Even when the page has been fully rendered in the most common browser window size of 1366 x 768 pixels, this means cutting up to 44 objects and 217 kB from the page weight. Of course, the final page weight varies by how much of the page a visitor views, but the bottom line is that these resources don’t delay the rendering of the primary page content. This comes at the cost of only a slight delay before the targeted images are displayed when the page initially loads and when it is scrolled. This delay might not be acceptable in all cases, but it’s a valuable tool to have on your belt.
3) Using Sprites
The concept of using sprites for images has always been closely tied to Steve Souders’ first rule for faster-loading websites, make fewer HTTP requests. The idea is simple: combine your background images into a single image, then use CSS to display only the important parts.
Historically there’s been some reluctance to embrace the use of sprites because it seems as though there’s a lot of work for marginal benefits. In the case of Velocity, I found that creation of the sprites only took minutes with the use of Steve Souders’ simple SpriteMe tool. The results were surprising:
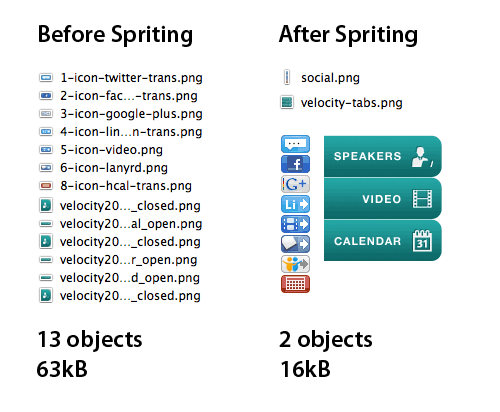
Just by combining some images and (once again) compressing the results, we saw a drop of page weight by 47 kB and the total number of objects reduced by 11.
4) Reassessing third-party widgets (Flickr and Twitter)
Third-party widget optimization can be one of the most difficult performance challenges to face. The code often isn’t your own, isn’t hosted on your servers, and, because of this, there are inherent inflexibilities. In the case of Velocity, we didn’t have many widgets to review and optimize. After we spent some time surveying the site, we found two widgets that needed some attention.
The Flickr widget
The Flickr widget on Velocity was using JavaScript to pull three 75×75 pixel images directly from Flickr so they could be displayed on the “2011 PHOTOS” section seen here:

There were a couple of problems with this. One, the randomization of images isn’t essential to the user experience. Two, even though the images from Flickr are only 75×75, they were averaging about 25 kB each, which is huge for a tiny JPEG. With this in mind, we did away with the JavaScript altogether and simply hosted compressed versions of the images on our CDN.
With that simple change, we saved 56 kB (going from 76 kB to 20 kB) in file size alone.
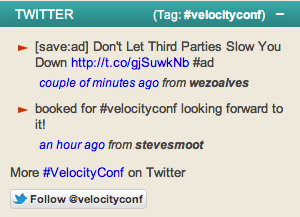
The “Tweet” widget
As luck would have it, there had already been talk of removing the Tweet widget from the Velocity site before we began our performance efforts. After some investigation into how often the widget was used, then some discussion of its usefulness, we decided the Twitter widget was no longer essential. We removed the Twitter widget and the JavaScript that was backing it.
The results
So without further ado, let’s look at the results of our two-day WPO deep dive. As you can see by our “after” Keynote readings, the total downloaded size dropped to 258.6 kB and the object count slimmed down to 34:

Our starting point of 507 kB with 87 objects, was reduced by 49%, with 56% fewer objects on the page.
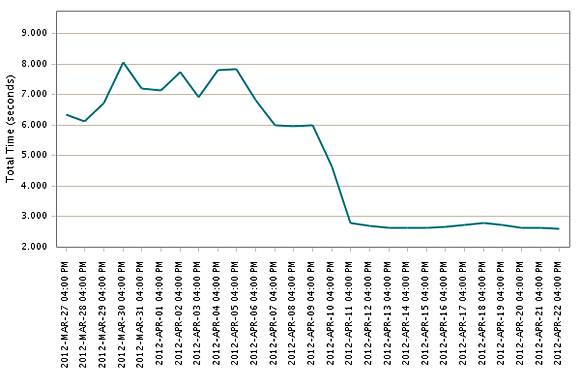
And for the most impressive illustration of the performance gains that were made, here’s the long-term graph of Velocity’s load times, in which they start around 7 seconds and settle around 2.5 seconds:
Conclusion
The biggest lesson we learned throughout this optimization process was that there isn’t one single change that makes your website fast. All of the small performance changes we made added up, and suddenly we were taking seconds off our page’s load times. With a little time and consideration, you may find similar performance enhancements in your own site.
And one last thing: Zeb and I will see you at Velocity in June.
 Velocity 2012: Web Operations & Performance — The smartest minds in web operations and performance are coming together for the Velocity Conference, being held June 25-27 in Santa Clara, Calif.
1, 2, 3Measurements and comparisons taken with Keynote (Application Perspective – ApP) Emulated Browser monitoring tools.
4We also applied this treatment to the sponsor banner in the page footer, for additional savings.