
Here’s an ageless insight that will endure well beyond the “era of big data“: poor collection practices and aging IT will derail any institutional efforts to use data analysis to improve performance.
According to an investigation by the Los Angeles Times, poor record-keeping is holding back state government efforts to upgrade California’s 911 system. As with any database project, beware “garbage in, garbage out,” or “GIGO.”
As Ben Welsh and Robert J. Lopez reported for the L.A. Times in December, California’s Emergency Medical Services Authority has been working to centralize performance data since 2009.
Unfortunately, it’s difficult to achieve data-driven improvements or manage against perceived issues by applying big data to the public sector if the data collection itself is flawed. The L.A. Times reported quality issues stemmed from how response times were measured to record keeping on paper to a failure to keep records at all.
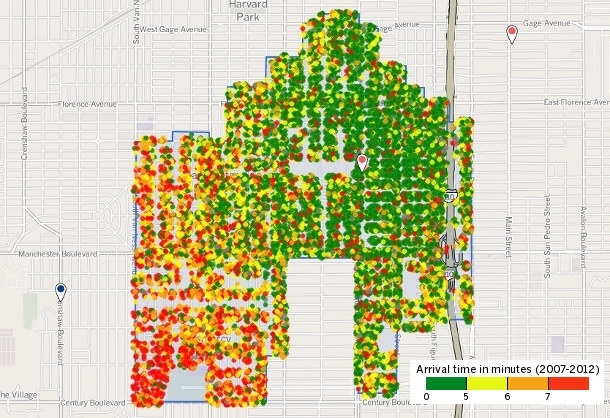
Image Credit: Ben Welsh, who mapped 911 response time data for Los Angeles Times.
When I shared this story with the Radar team, Nat Torkington suggested revisiting the “Observe, Orient, Decide, and Act” (OODA) loop familiar to military strategists.
“If your observations are flawed, your decisions will be too,” wrote Nat, in an email exchange. “If you pump technology investment into the D phase, without similarly improving the Os, you’ll make your crappy decisions faster.”
Alistair Croll explored the relevance of OODA to big data in his post on the feedback economy last year. If California wants to catalyze the use of data-driven analysis to improve response times that vary by geography and jurisdictions, start with the first “O.”
The set of factors at play here, however, means that there won’t be a single silver bullet for putting California’s effort back on track. Lack of participation and reporting standards, and old IT systems are all at issue — and given California’s ongoing financial issues, upgrading the latter and requiring local fire departments and ambulance firms to spend time and money on data collection will not be an easy sell.
Filed from the data desk
The investigative work of the L.A. Times was substantially supported by its Data Desk, a team of reporters and web developers that specializes in maps, databases, analysis and visualization. I included their interactive visualization mapping how fast the Los Angeles Fire Department responded to calls in my recent post on how data journalism is making sense of the world. When I profiled Ben Welsh’s work last year in our data journalist series, he told me this kind of project is exactly the sort of work he’s most proud of doing.
“As we all know, there’s a lot of data out there,” said Welsh, in our interview, “and, as anyone who works with it knows, most of it is crap. The projects I’m most proud of have taken large, ugly datasets and refined them into something worth knowing: a nut graf in an investigative story or a data-driven app that gives the reader some new insight into the world around them.”
The Data Desk set a high bar in this most recent investigation by not only making sense of the data, but also in releasing the data behind the open source maps of California’s emergency medical agencies it published as part of the series.
This isn’t the first time they’ve made code available. As Welsh noted in a post about the series, the Data Desk has “previously written about the technical methods used to conduct [the] investigation, released the base layer created for an interactive map of response times and contributed the location of LAFD’s 106 fire station to the Open Street Map.”
Creating an open source newsroom is not easy. In sharing not only its code but its data, the Los Angeles Times is setting a notable example for the practice of open journalism in the 21st century, building out the newsroom stack and hinting at media’s networked future.
This post is part of our series investigating data journalism.