
One of the most popular offerings at Strata Santa Clara was Hardcore Data Science day. Over the next few weeks we hope to profile some of the speakers who presented, and make the video of the talks available as a bundle. In the meantime here are some notes and highlights from a day packed with great talks.
Data Structures
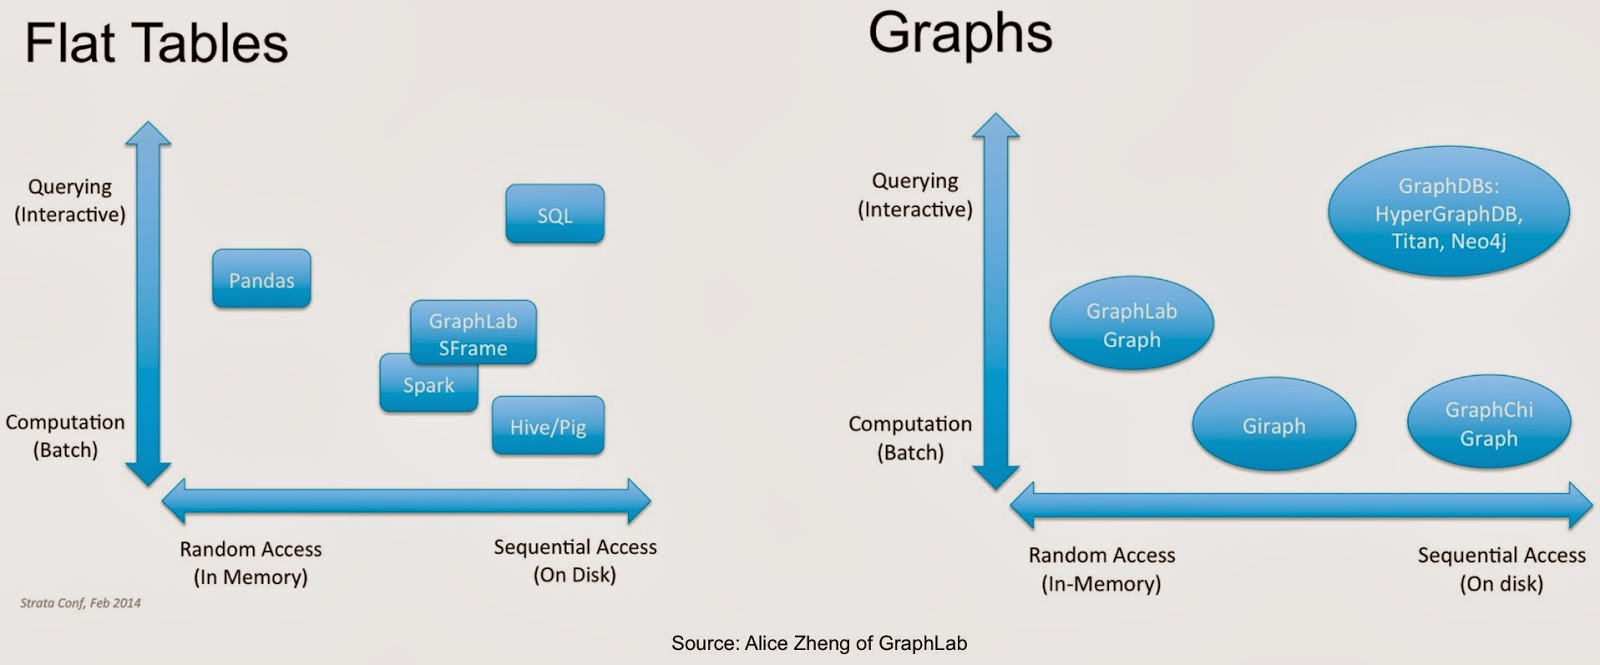
We’ve come to think of analytics as being comprised primarily of data and algorithms. Once data has been collected, “wrangled”, and stored, algorithms are unleashed to unlock its value. Longtime machine-learning researcher Alice Zheng of GraphLab, reminded attendees that data structures are critical to scaling machine-learning algorithms. Unfortunately there is a disconnect between machine-learning research and implementation (so much so, that some recent advances in large-scale ML are “rediscoveries” of known data structures):

While there are many data structures that arise in computer science, Alice devoted her talk to two data structures1 that are widely used in machine-learning:
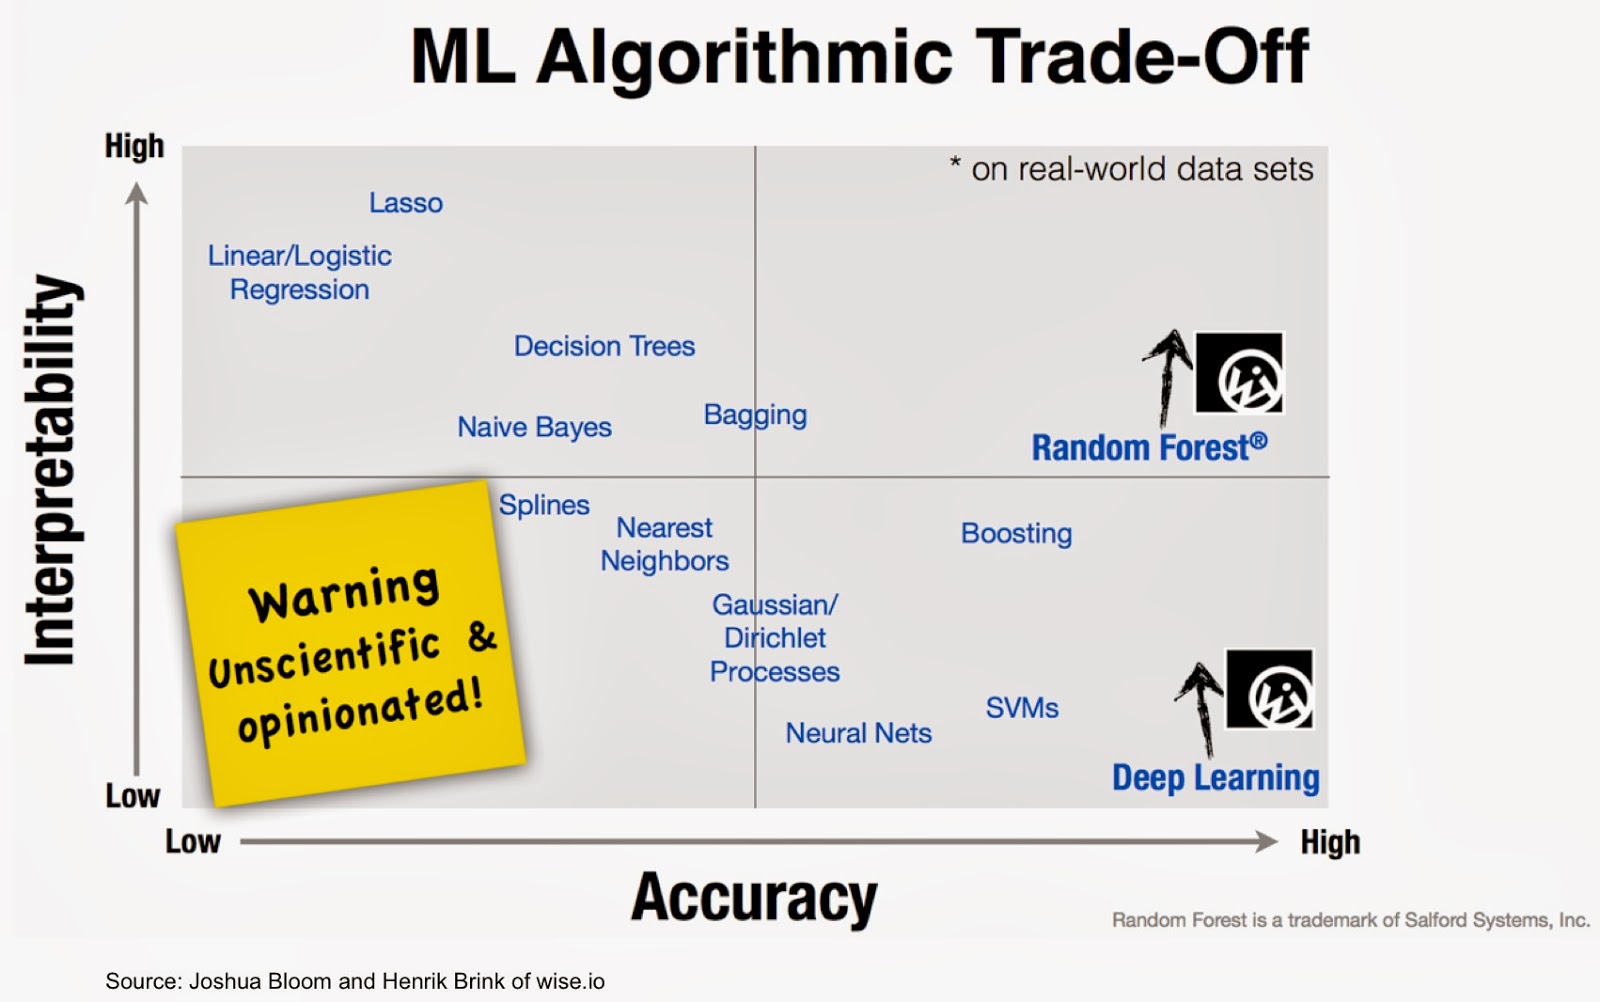
Practical considerations: implementation, interpretability, accuracy, scalability
Josh Bloom and Henrik Brink of wise.io talked about the importance of treating machine-learning deployment on par with the deployment of other critical software tools. This means having to maintain reproducible workflows while having to optimize between different decision factors (e.g. fast vs. accurate vs. interpretable).
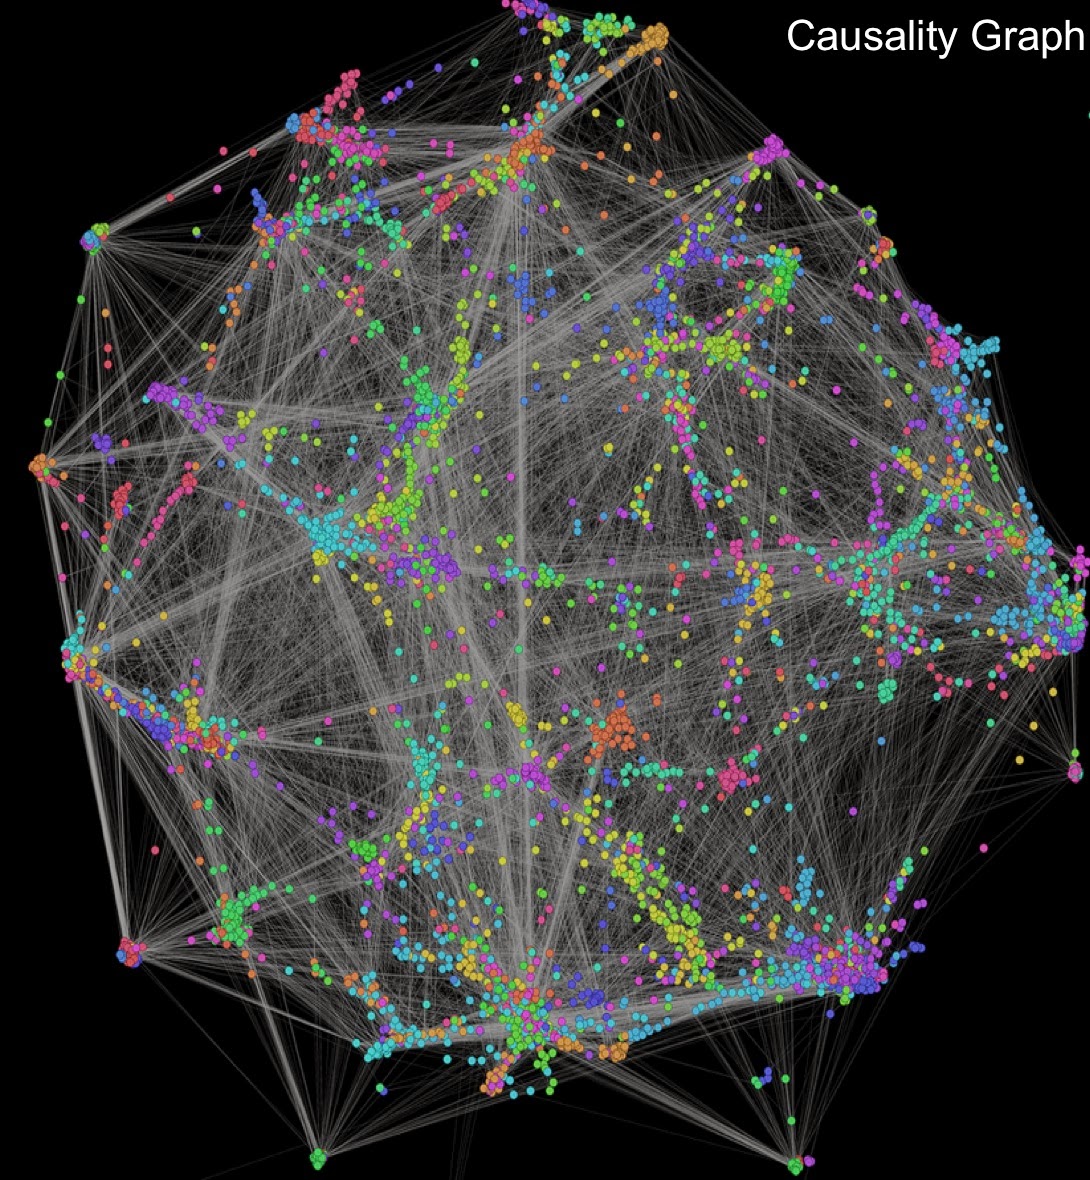
Kira Radinsky gave a detailed overview of the interesting analytic tools that power SalesPredict. She reiterated the importance of explainability, to the users of data science products. Those users also need to be able to “act” on results produced by algorithms. Kira described a tool (built using social network analysis) to help users connect with prospects produced by SalesPredict. She closed her presentation by hinting at an interesting system that can be used to trace connections2 and correlations, and gave an illustration3 of how companies and sales people may use such a system. Built primarily using web documents and 30M newspaper articles, the SalesPredict causality graph currently consists of 300 million nodes and 1 billion edges (stored in a small cluster).
Other bits
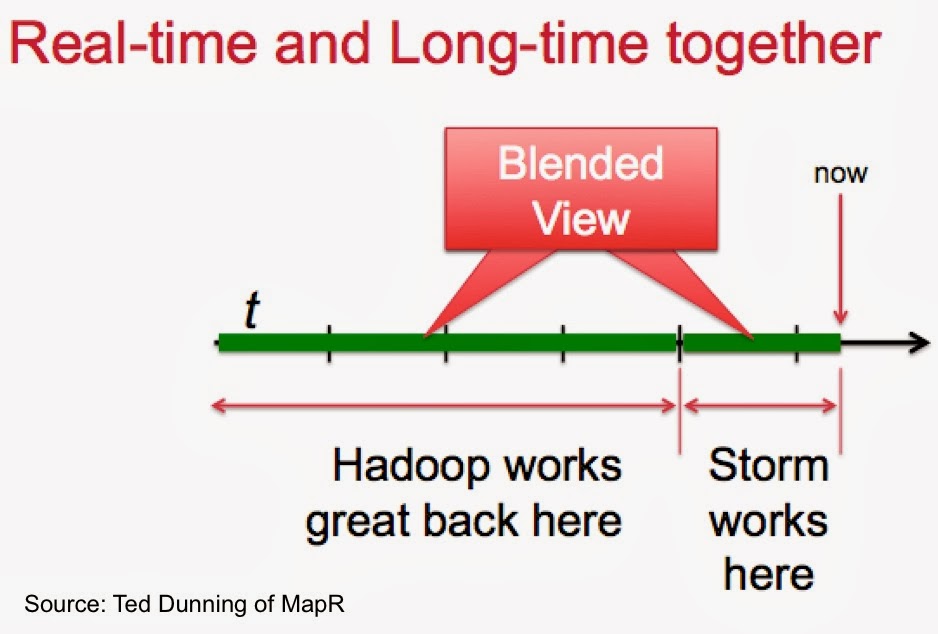
Ted Dunning gave an interesting and highly-rated overview of anomaly detection, which included tips and hints on how to build systems that combine real-time and long-time data processing and analysis.
Strata is an event that draws (academic) researchers and practitioners, and hopefully spurs conversations between the two communities. Magda Balazinska presented three interesting academic research projects designed to make big data management systems easier. Judging from the Q&A and the Twitter stream, these academic projects drew lots of interest from the audience.
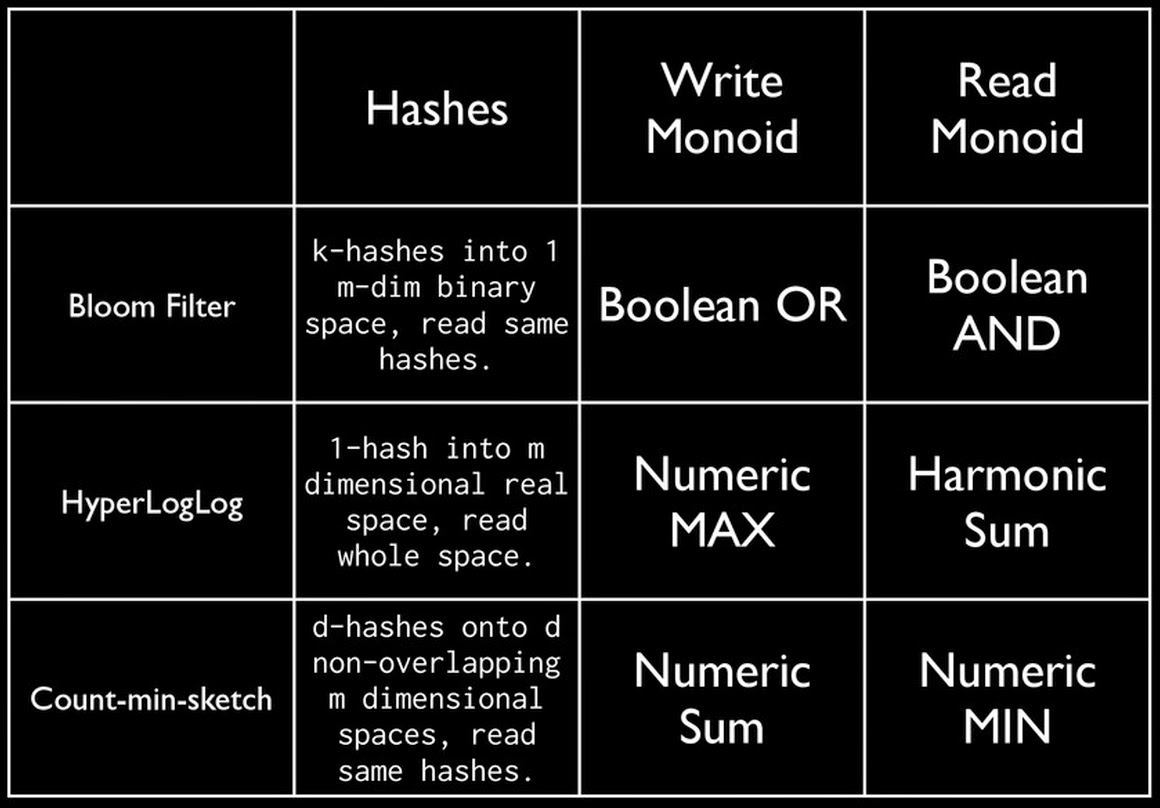
Oscar Boykin ended the day by describing the use of algebra (monoids) and hashes in data processing and data mining systems already in production at Twitter and other companies. Hashed data can be represented as sets, maps and other objects that are familiar to programmers. And since hashed sketches are monoids they are efficient to use in map/reduce or streaming applications.
Related Content:
- Deep Learning Oral Traditions: Ilya Sutskever gave a well-received presentation on Deep Learning
- Stream Mining essentials: includes a brief description of some popular sketches
- Gaining access to the best machine-learning methods
- Data Analysis: Just one component of the Data Science workflow
(1) Previewed at Strata, GraphLab’s SFrame is a scalable, tabular data structure that lets users perform many data wrangling tasks.
(2) A big data tool, reminiscent of the software James Burke used in his Strata keynote presentation.
(3) She described how the Causality Graph uncovered how the tsunami impacted the iPad’s supply chain and sales.