

As new tools for distributed storage and analysis of big data are becoming more stable and widely known, there is a growing need for discovering best practices for analytics at this scale. One of the areas of widespread interest that crosses many verticals is anomaly detection.
At its best, anomaly detection is used to find unusual, rarely occurring events or data for which little is known in advance. Examples include changes in sensor data reported for a variety of parameters, suspicious behavior on secure websites, or unexpected changes in web traffic. In some cases, the data patterns being examined are simple and regular and, thus, fairly easy to model.
Anomaly detection approaches start with some essential but sometimes overlooked ideas about anomalies:
- Anomalies are defined not by their own characteristics but in contrast to what is normal.
Thus …
- Before you can spot an anomaly, you first have to figure out what “normal” actually is.
This need to first discover what is considered “normal” may seem obvious, but it is not always obvious how to do it, especially in situations with complicated patterns of behavior. Best results are achieved when you use statistical methods to build an adaptive model of events in the system you are analyzing as a first step toward discovering anomalous behavior.
Using these statistical methods to model what is normal is fairly straightforward for systems with simple data patterns, but more complex systems can present a considerable challenge. The good news is that there are some new and practical methods that make many complex systems fairly easy to model well. Consider, for instance, systems with repetitive (not periodic) complex data patterns. A complicated signal such as an EKG trace is a good example. How do you model the shape of a normal EKG signal so that you can use that as a reference for detecting abnormal heart function?
The problem becomes approachable by first breaking the complex EKG pattern in training data into small pieces that are easier to recognize. This technique is called windowing. The EKG signal has a complicated shape, but if you look at small windows of that data, you see simple patterns that are repeated.
Windowing and sparse coding, a simplified form of deep learning, provide a way to deal with complex repetitive patterns when you need to build a model to accurately predict them.
Using sparse coding, you can build a dictionary of all the sub-shapes you encounter in training data. This allows you to analyze new signals of the same general kind. The modeling method known as clustering can be used to identify the prototypical patterns that best fit each shape. In the following example, a k-means clustering algorithm was used to ensure that each single shape in the dictionary of shapes is an appropriate selection.
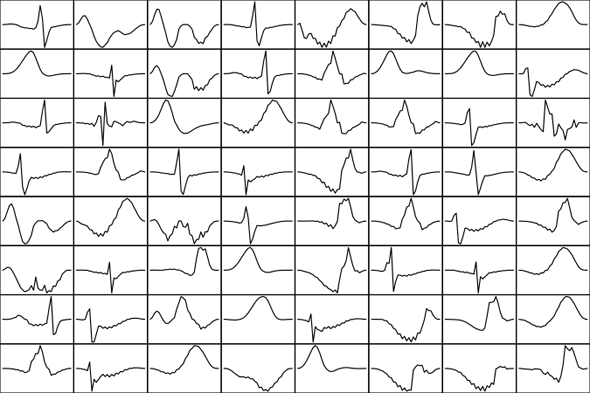
Dictionary of shapes from an EKG signal used as training data. Chart courtesy Ellen Friedman and Ted Dunning.
Here’s how this works in developing an anomaly detector. Once you have used training data to build a dictionary of shapes, you apply the windowing and sparse coding method to the new signal of interest (call it the original signal). You compare the sub-shapes of the original signal to those in the dictionary of reference shapes and use the best sub-shape for each window to reconstruct a the signal from these prototypes (call this the reconstructed signal). To find anomalies, you then compare the reconstructed signal to the original signal to compute the reconstruction error. Where the reconstruction error is large, you’ve discovered a probable anomaly because this is a part of the original signal that your model cannot describe accurately. In other words, this part of the signal is an outlier.
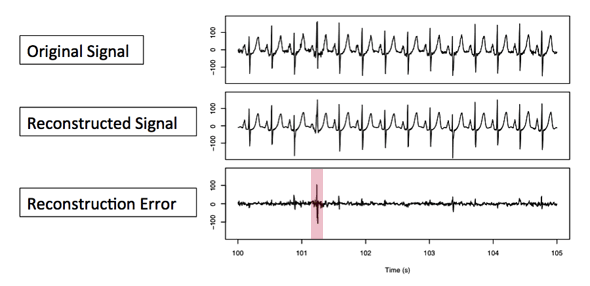
Anomaly detection in EKG data. The difference in the comparison between original signal being tested and the prototype reconstructed from the dictionary of shapes is the reconstruction error, the clue to anomalies in the original signal. Chart courtesy Ellen Friedman and Ted Dunning.
Here you can see a spike on the bottom graph, the one that shows a reconstruction error, at just past time 101. This spike is a clue that an anomaly occurred in the original signal (top graph) at this time. Do you see that the reconstruction signal (middle graph) has an odd shape at this same time point?
For a full description of this sensor data example plus other anomaly detection use cases and techniques, download a free copy of Practical Machine Learning: A New Look at Anomaly Detection from the MapR site.
You can follow the authors on Twitter: @Ellen_Friedman and @ted_dunning. You can contact Ted with technical questions via email ted@mapr.com.
This post is part of a collaboration between O’Reilly and MapR. See our statement of editorial independence.
Photo by Patrick Hoesly on Flickr, used under a Creative Commons license.