
Download a free copy of our new report “Data-Informed Product Design,“ by Pamela Pavliscak. Editor’s note: this post is an excerpt from the report.
There is a lot of hype about “data-driven” or “data-informed” design, but there is very little agreement about what it really means. Even deciding how to define data is difficult for teams with spotty access to data in the organization, uneven understanding, and little shared language. For some interactive products, it’s possible to have analytics, A/B tests, surveys, intercepts, benchmarks, scores of usability tests, ethnographic studies, and interviews. But what counts as data? And more important, what will inform design in a meaningful way?
When it comes to data, we tend to think in dichotomies: quantitative and qualitative, objective and subjective, abstract and sensory, messy and curated, business and user experience, science and story. Thinking about the key differences can help us to sort out how it fits together, but it can also set up unproductive oppositions. Using data for design does not have to be an either/or; instead, it should be yes, and…
Big data and the user experience
At its simplest, big data is data generated by machines recording what people do and say. Some of this data is simply counts — counts of who has come to your website, how they got there, how long they stayed, and what they clicked or tapped. They also could be counts of how many clicked A and how many clicked B, or perhaps counts of purchases or transactions.
For a site such as Amazon, there are a million different articles for sale, several million customers, a hundred million sales transactions, and billions of clicks. The big challenge is how to cluster only the 250,000 best customers or how to reduce 1,000 data dimensions to only two or three relevant ones. Big data has to be cleaned, segmented, and visualized to start getting a sense of what it might mean.
Some of this data also includes more complex events, such as user event streams, social media activity, and information captured by sensors in a mobile app. When we talk about big data, we’re often referring to more than just the sheer size of the raw data. Big data is also the increasingly sophisticated algorithms generating insights, which my colleague Steve Ellis, invoking Einstein, calls “spooky action at a distance.”
Netflix is an example of a company that actively employs big data for design decisions. Few companies have as much data about their users as Netflix, and few use it across so many aspects of the experience. One goal is to predict what people will watch — see Figure 2-1. To that end, Netflix looks at relationships between subscriber viewing habits, recommendations, ratings, and even covers. When we click the pause button on Netflix, we trigger an event that can be logged and used to make predictions. Yet for all its predictive power, many suspect that big data by its very nature is missing something. Why did this Netflix user hit pause? Did she get bored? Did she get a snack? Did she take offense? Human experience is complex, after all.
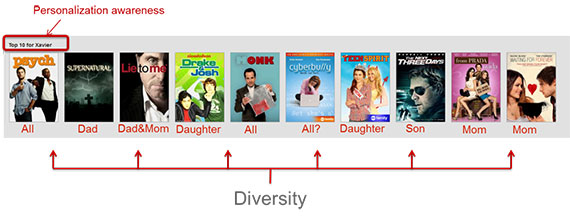
Figure 2-1: Net‚ix top 10 recommendations. Source: Net‚flix Tech Blog.
Many experts will argue that big data, for all its power, can leave big questions unanswered, such as why people take action or why they don’t. Big data is still mostly about the what and less about the why, these same experts will argue. What they mean is that big data has a harder time understanding the reality of lived human experience in all its complicated glory, and understanding this reality of lived human experience is where the real insights lay.
In puzzling this all out, I’ve found distinguishing between big data and thick data to be useful. If big data is the archeology of user experience or the study of the traces that people leave behind, thick data is more like anthropology, exploring lives as they are being lived online.
Thick data and UX
In traditional field research, learning about why people do what they do relies on a kind of collaboration between researcher and subject. It relies on thoughtful conversation, close observation, and empathy. It’s messy — and it produces its own kind of data. €
Thick data, based on Clifford Geertz’s call for “thick description” in ethnographic studies, is what many organizations have begun calling the output from this deep, descriptive approach. Lego, for example, used thick data to revamp the brand. Even though preliminary data indicated that kids wanted toys they could play with instantly, Lego’s action figures were not taking off. So, researchers used a diary study to learn how and why kids play. Categorizing and coding photos, journal entries, and other artifacts revealed patterns that led Lego “back to the brick.”
Analysis of thick data tends to be less systematic and more intuitive. Some researchers transcribe and code the interviews and artifacts, using that as a way to formulate themes, although much design research can bypass this step. This doesn’t make the research itself less relevant, but it might make it seem less credible in some organizations.
Relying on small studies for big insights or guiding principles is not at all unusual, though, especially with research that deals with human behavior. Dan Ariely’s hugely influential insights on relativity in pricing emerged from an experiment with 100 MIT students. However, small samples aren’t limited to behavioral studies. FDA drug trials are often conducted with fewer than 50 people. Design research can provide direction with less than 20 people.
Table 2-1: Big data and thick data
| Big data | Thick data |
| What, where, when, how | How and why |
| Transactions, customer service logs, analytics, A/B tests, social media posts, GPS | Interviews, contextual research, usability studies |
| Multi-structured | Description |
| A large number of people | Relatively few people |
| Collected by machines | Collected by people |
| Broad | In-depth |
| Behaviors and actions of many people | Behaviors, actions, emotions, intentions, motivations of a few |
| Collected as people do what they normally do | Collected as part of a study |
| People are not highly aware of data being collected | People are highly aware of data being collected |
| Analysis uses statistical methods | Analysis includes developing codes, summaries, and themes |
More than just filling in where big data leaves off, thick data can provide a new perspective on how people experience designs (see Table 2-1). Big data gives new insights into what people do on their own, and on a massive scale. Thick data reveals motivations, intent, emotions that might not be obvious from big data.