
 I lead a research team of data scientists responsible for discovering insights that lead to market and competitive intelligence for our company, Computer Sciences Corporation (CSC). We are a busy group. We get questions from all different areas of the company and it’s important to be agile.
The nature of data science is experimental. You don’t know the answer to the question asked of you — or even if an answer exists. You don’t know how long it will take to produce a result or how much data you need. The easiest approach is to just come up with an idea and work on it until you have something. But for those of us with deadlines and expectations, that approach doesn’t fly. Companies that issue you regular paychecks usually want insight into your progress.
This is where being agile matters. An agile data scientist works in small iterations, pivots based on results, and learns along the way. Being agile doesn’t guarantee that an idea will succeed, but it does decrease the amount of time it takes to spot a dead end. Agile data science lets you deliver results on a regular basis and it keeps stakeholders engaged.
The key to agile data science is delivering data products in defined time boxes — say, two- to three-week sprints. Short delivery cycles force us to be creative and break our research into small chunks that can be tested using minimum viable experiments. We deliver something tangible after almost every sprint for our stakeholders to review and give us feedback. Our stakeholders get better visibility into our work, and we learn early on if we are on track.
This approach might sound obvious, but it isn’t always natural for the team. We have to get used to working on just enough to meet stakeholder’s needs and resist the urge to make solutions perfect before moving on. After we make something work in one sprint, we make it better in the next only if we can find a really good reason to do so.
An example using the StackOverflow Data Explorer
Being an agile data scientist sounds good, but it’s not always obvious how to put the theory into everyday practice. In business, we are used to thinking about things in terms of tasks, but the agile data scientist has to be able to convert a task-oriented approach into an experiment-oriented approach. Here’s a recent example from my personal experience.
Our CTO is responsible for making sure the company has the next-generation skills we need to stay competitive — that takes data. We have to know what skills are hot and how difficult they are to attract and retain. Our team was given the task of categorizing key skills by how important they are, and by how rare they are.
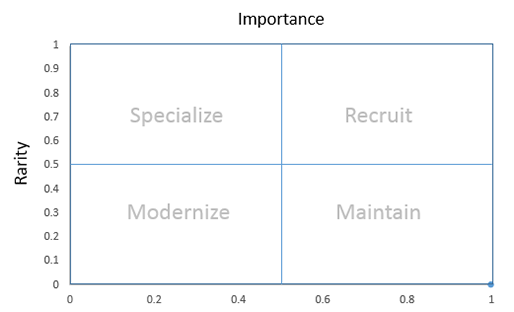
Image courtesy of Jerry Overton.
We already developed the ability to categorize key skills as important or not. By mining years of CIO survey results, social media sites, job boards, and internal HR records, we could produce a list of the skills most needed to support any of CSC’s IT priorities. For example, the following is a list programming language skills with the highest utility across all areas of the company:
| Language | Importance (0-1 scale) |
| Java | 1 |
| SQL | 0.4 |
| Python | 0.3 |
| C# | 0.2 |
| C++ | 0.1 |
| Perl | 0.1 |
Note that this is a composite score for all the different technology domains we considered. The importance of Python, for example, varies a lot depending on whether or not you are hiring for a data scientist or a mainframe specialist.
For our top skills, we had the “importance” dimension, but we still needed the “abundance” dimension. We considered purchasing IT survey data that could tell us how many IT professionals had a particular skill, but we couldn’t find a source with enough breadth and detail. We considered conducting a survey of our own, but that would be expensive and time-consuming. Instead, we decided to take a step back and perform an agile experiment.
Our goal was to find the relative number of technical professionals with a certain skill. Perhaps we could estimate that number based on activity within a technical community. It seemed reasonable to assume that the more people who have a skill, the more you will see helpful posts in communities like StackOverflow. For example, if there are twice as many Java programmers as Python programmers, you should see about twice as many helpful Java programmer posts as Python programmer posts. Which led us to a hypothesis:
You can predict the relative number of technical professionals with a certain IT skill based on the relative number of helpful contributors in a technical community.
We looked for the fastest, cheapest way to test the hypothesis. We took a handful of important programming skills and counted the number of unique contributors with posts rated above a certain threshold. We ran this query in the StackOverflow Data Explorer:
SELECT
 Count(DISTINCT Users.Id),
 Tags.TagName as Tag_Name
FROM
 Users, Posts, PostTags, Tags
WHERE
 Posts.OwnerUserId = Users.Id AND
 PostTags.PostId = Posts.Id AND
 Tags.Id = PostTags.TagId AND
 Posts.Score > 15 AND
 Posts.CreationDate BETWEEN '1/1/2012' AND '1/1/2015' AND
 Tags.TagName IN ('python', 'r', 'java', 'perl', 'sql', 'c#', 'c++')
GROUP BY
 Tags.TagName
Which gave us these results:
| Programming Language | Unique Contributors | Scaled Value (0-1) |
| Java | 2276 | 1.00 |
| C# | 1868 | 0.82 |
| C++ | 1529 | 0.67 |
| Python | 1380 | 0.61 |
| SQL | 314 | 0.14 |
| Perl | 70 | 0.03 |
We converted the scores according to a linear scale with the the top score mapped to 1 and the lowest score being 0. Considering a skill to be “plentiful” is a relative thing. We decided to use the skill with the highest population score as the standard. At first glance, these results seemed to match our intuition, but we needed a simple, objective way of cross-validating the results. We considered looking for a targeted IT professional survey, but decided to perform a simple LinkedIn people search instead. We went into LinkedIn, typed a programming language into the search box and recorded the number of people with that skill:
| Programming Language | LinkedIn Population (M) | Scaled Value (0-1) |
| SQL | 5.2 | 1.00 |
| Java | 4.6 | 0.88 |
| C++ | 3 | 0.58 |
| C# | 1.7 | 0.33 |
| Python | 1 | 0.19 |
| Perl | 0.5 | 0.10 |
Some of the results of the experiment matched the cross-validation, but some were way off. The Java and C++ population scores predicted by the experiment matched pretty closely with the validation. But the experiment predicted that SQL would be one of the rarest skills, while the LinkedIn search told us that it is the most plentiful. This discrepancy makes sense. Foundational skills, like SQL, that have been around a while will have a lot of practitioners, but are unlikely to be a hot topic of discussion. By the way, adjusting the allowable post creation dates made little difference to the relative outcome.
We couldn’t confirm the hypothesis, but we learned something valuable. Why not just use the number of people that show up in the LinkedIn search as the measure of our population with the particular skill? We have to build the population list by hand, but that kind of grunt work is the cost of doing business in data science. Combining the results of LinkedIn searches with our previous analysis of skills importance, we can categorize programming language skills for the company:
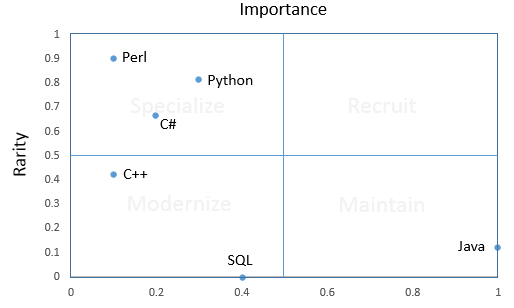
Image courtesy of Jerry Overton.
Lessons learned from a minimum viable experiment
The entire experiment, from hypothesis to conclusion, took just three hours to complete. Along the way, there were concerns about which StackOverflow contributors to include, how to define a helpful post, and the allowable sizes of technical communities — the list of possible pitfalls went on and on. But we were able to slice through the noise and stay focused on what mattered by sticking to a basic hypothesis and a minimum viable experiment.
Using simple tests and minimum viable experiments, we learned enough to deliver real value to our stakeholders in a very short amount of time. No one is getting hired or fired based on these results, but we can now recommend to our stakeholders strategies for getting the most out of our skills. We can recommend targets for recruiting and strategies for prioritizing talent development efforts. Best of all, I think, we can tell our stakeholders how these priorities should change depending on the technology domain.
Image on article and category pages by Mark Piet, used under a Creative Commons license.