Ben Lorica

Ben Lorica is the Chief Data Scientist of O'Reilly Media, Inc. and Program Director of Strata+Hadoop World. He has applied Business Intelligence, Data Mining, Machine Learning and Statistical Analysis in a variety of settings including Direct Marketing, Consumer and Market Research, Targeted Advertising, Text Mining, and Financial Engineering. His background includes stints with an investment management company, internet startups, and financial services.
Redefining power distribution using big data
The O'Reilly Data Show Podcast: Erich Nachbar on testing and deploying open source, distributed computing components.
 When I first hear of a new open source project that might help me solve a problem, the first thing I do is ask around to see if any of my friends have tested it. Sometimes, however, the early descriptions sound so promising that I just jump right in and try it myself — and in a few cases, I transition immediately (this was certainly the case for Spark).
I recently had a conversation with Erich Nachbar, founder and CTO of Virtual Power Systems, and one of the earliest adopters of Spark. In the early days of Spark, Nachbar was CTO of Quantifind, a startup often cited by the creators of Spark as one of the first “production deployments.” On the latest episode of the O’Reilly Data Show Podcast, we talk about the ease with which Nachbar integrates new open source components into existing infrastructure, his contributions to Mesos, and his new “software-defined power distribution” startup.
Ecosystem of open source big data technologies
When evaluating a new software component, nothing beats testing it against workloads that mimic your own. Nachbar has had the luxury of working in organizations where introducing new components isn’t subject to multiple levels of decision-making. But, as he notes, everything starts with testing things for yourself:
“I have sort of my mini test suite…If it’s a data store, I would just essentially hook it up to something that’s readily available, some feed like a Twitter fire hose, and then just let it be bombarded with data, and by now, it’s my simple benchmark to know what is acceptable and what isn’t for the machine…I think if more people, instead of reading papers and paying people to tell them how good or bad things are, would actually set aside a day and try it, I think they would learn a lot more about the system than just reading about it and theorizing about the system. Read more…
Let’s build open source tensor libraries for data science
Tensor methods for machine learning are fast, accurate, and scalable, but we'll need well-developed libraries.

Data scientists frequently find themselves dealing with high-dimensional feature spaces. As an example, text mining usually involves vocabularies comprised of 10,000+ different words. Many analytic problems involve linear algebra, particularly 2D matrix factorization techniques, for which several open source implementations are available. Anyone working on implementing machine learning algorithms ends up needing a good library for matrix analysis and operations.
But why stop at 2D representations? In a recent Strata + Hadoop World San Jose presentation, UC Irvine professor Anima Anandkumar described how techniques developed for higher-dimensional arrays can be applied to machine learning. Tensors are generalizations of matrices that let you look beyond pairwise relationships to higher-dimensional models (a matrix is a second-order tensor). For instance, one can examine patterns between any three (or more) dimensions in data sets. In a text mining application, this leads to models that incorporate the co-occurrence of three or more words, and in social networks, you can use tensors to encode arbitrary degrees of influence (e.g., “friend of friend of friend” of a user).
Being able to capture higher-order relationships proves to be quite useful. In her talk, Anandkumar described applications to latent variable models — including text mining (topic models), information science (social network analysis), recommender systems, and deep neural networks. A natural entry point for applications is to look at generalizations of matrix (2D) techniques to higher-dimensional arrays. Read more…
Turning Ph.D.s into industrial data scientists and data engineers
The O'Reilly Data Show Podcast: Angie Ma on building a finishing school for science and engineering doctorates.

Editor’s note: The ASI will offer a two-day intensive course, Practical Machine Learning, at Strata + Hadoop World in London in May.
Back when I was considering leaving academia, the popular exit route was financial engineering. Many science and engineering Ph.D.s ended up in big Wall Street banks; I chose to be the lead quant at a small hedge fund — it was a natural choice for many of us. Financial engineering was topically close to my academic interests, and working with traders meant access to resources and interesting problems.
Today, there are many more options for people with science and engineering doctorates. A few organizations take science and engineering Ph.D.s, and over the course of 8-12 weeks, prepare them to join the ranks of industrial data scientists and data engineers.
I recently sat down with Angie Ma, co-founder and president of ASI, a London startup that runs a carefully structured “finishing school” for science and engineering doctorates. We talked about how Angie and her co-founders (all ex-physicists) arrived at the concept of the ASI, the structure of their training programs, and the data and startup scene in the UK. [Full disclosure: I’m an advisor to the ASI.] Read more…
Topic models: Past, present, and future
The O'Reilly Data Show Podcast: David Blei, co-creator of one of the most popular tools in text mining and machine learning.

I don’t remember when I first came across topic models, but I do remember being an early proponent of them in industry. I came to appreciate how useful they were for exploring and navigating large amounts of unstructured text, and was able to use them, with some success, in consulting projects. When an MCMC algorithm came out, I even cooked up a Java program that I came to rely on (up until Mallet came along).
I recently sat down with David Blei, co-author of the seminal paper on topic models, and who remains one of the leading researchers in the field. We talked about the origins of topic models, their applications, improvements to the underlying algorithms, and his new role in training data scientists at Columbia University.
Generating features for other machine learning tasks
Blei frequently interacts with companies that use ideas from his group’s research projects. He noted that people in industry frequently use topic models for “feature generation.” The added bonus is that topic models produce features that are easy to explain and interpret:
“You might analyze a bunch of New York Times articles for example, and there’ll be an article about sports and business, and you get a representation of that article that says this is an article and it’s about sports and business. Of course, the ideas of sports and business were also discovered by the algorithm, but that representation, it turns out, is also useful for prediction. My understanding when I speak to people at different startup companies and other more established companies is that a lot of technology companies are using topic modeling to generate this representation of documents in terms of the discovered topics, and then using that representation in other algorithms for things like classification or other things.”
Forecasting events, from disease outbreaks to sales to cancer research
The O'Reilly Data Show Podcast: Kira Radinsky on predicting events using machine learning, NLP, and semantic analysis.
Editor’s note: One of the more popular speakers at Strata + Hadoop World, Kira Radinsky was recently profiled in the new O’Reilly Radar report, Women in Data: Cutting-Edge Practitioners and Their Views on Critical Skills, Background, and Education.
When I first took over organizing Hardcore Data Science at Strata + Hadoop World, one of the first speakers I invited was Kira Radinsky. Radinsky had already garnered international recognition for her work forecasting real-world events (disease outbreak, riots, etc.). She’s currently the CTO and co-founder of SalesPredict, a start-up using predictive analytics to “understand who’s ready to buy, who may buy more, and who is likely to churn.”
I recently had a conversation with Radinsky, and she took me through the many techniques and subject domains from her past and present research projects. In grad school, she helped build a predictive system that combined newspaper articles, Wikipedia, and other open data sets. Through fine-tuned semantic analysis and NLP, Radinsky and her collaborators devised new metrics of similarity between events. The techniques she developed for that predictive software system are now the foundation of applications across many areas. Read more…
Network structure and dynamics in online social systems
Understanding information cascades, viral content, and significant relationships.

I rarely work with social network data, but I’m familiar with the standard problems confronting data scientists who work in this area. These include questions pertaining to network structure, viral content, and the dynamics of information cascades.
At last year’s Strata + Hadoop World NYC, Cornell Professor and Nevanlinna Prize Winner Jon Kleinberg walked the audience through a series of examples from social network analysis, looking at the content of shared photos and text, as well as the structures of the networks. It was a truly memorable presentation from one of the foremost experts in network analysis. Each of the problems he discussed would be of interest to marketing professionals, and the analytic techniques he described were accessible to many data scientists. What struck me is that while these topics are easy to describe, framing the right question requires quite a bit of experience with the underlying data.
Predicting whether an information cascade will double in size
Can you predict if a piece of information (say a photo) will be shared only a few times or hundreds (if not thousands) of times? Large cascades are very rare, making the task of predicting eventual size difficult. You either default to a pathological answer (after all most pieces of information are shared only once), or you create a balanced data set (comprised of an equal number of small and large cascades) and end up solving an artificial task.
Thinking of a social network as an information transport layer, Kleinberg and his colleagues instead set out to track the evolution of cascades. In the process, they framed an interesting balanced algorithmic prediction problem: given a cascade of size k, predict whether it will reach size 2k (it turns out 2k is roughly the median size of a cascade conditional on whether it reaches size k). Read more…
The evolution of GraphLab
The O'Reilly Data Show Podcast: Carlos Guestrin on the early days of GraphLab and the evolution of GraphLab Create.
I only really started playing around with GraphLab when the companion project GraphChi came onto the scene. By then I’d heard from many avid users and admired how their user conference instantly became a popular San Francisco Bay Area data science event. For this podcast episode, I sat down with Carlos Guestrin, co-founder/CEO of Dato, a start-up launched by the creators of GraphLab. We talked about the early days of GraphLab, the evolution of GraphLab Create, and what’s he’s learned from starting a company.
MATLAB for graphs
Guestrin remains a professor of computer science at the University of Washington, and GraphLab originated when he was still a faculty member at Carnegie Mellon. GraphLab was built by avid MATLAB users who needed to do large scale graphical computations to demonstrate their research results. Guestrin shared some of the backstory:
“I was a professor at Carnegie Mellon for about eight years before I moved to Seattle. A couple of my students, Joey Gonzales and Yucheng Low were working on large scale distributed machine learning algorithms specially with things called graphical models. We tried to implement them to show off the theorems that we had proven. We tried to run those things on top of Hadoop and it was really slow. We ended up writing those algorithms on top of MPI which is a high performance computing library and it was just a pain. It took a long time and it was hard to reproduce the results and the impact it had on us is that writing papers became a pain. We wanted a system for my lab that allowed us to write more papers more quickly. That was the goal. In other words so they could implement this machine learning algorithms more easily, more quickly specifically on graph data which is what we focused on.”
Building and deploying large-scale machine learning pipelines
We need primitives; pipeline synthesis tools; and most importantly, error analysis and verification.
Register for Hardcore Data Science Day at Strata + Hadoop World NYC 2015, which takes place September 29 to October 1.
There are many algorithms with implementations that scale to large data sets (this list includes matrix factorization, SVM, logistic regression, LASSO, and many others). In fact, machine learning experts are fond of pointing out: if you can pose your problem as a simple optimization problem then you’re almost done.
Of course, in practice, most machine learning projects can’t be reduced to simple optimization problems. Data scientists have to manage and maintain complex data projects, and the analytic problems they need to tackle usually involve specialized machine learning pipelines. Decisions at one stage affect things that happen downstream, so interactions between parts of a pipeline are an area of active research.
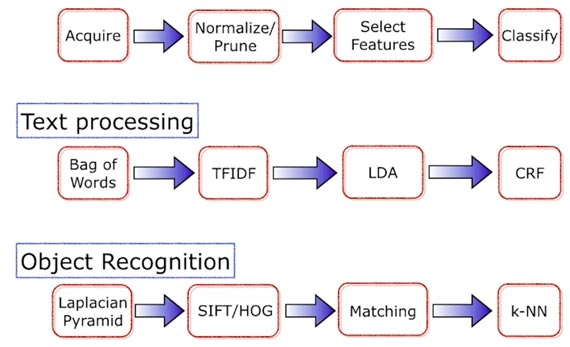
Some common machine learning pipelines. Source: Ben Recht, used with permission.
In his 2014 Strata + Hadoop World New York presentation, UC Berkeley professor Ben Recht described new UC Berkeley AMPLab projects for building and managing large-scale machine learning pipelines. Given AMPLab’s ties to the Spark community, some of the ideas from their projects are starting to appear in Apache Spark. Read more…
A brief look at data science’s past and future
In this O'Reilly Data Show Podcast: DJ Patil weighs in on a wide range of topics in data science and big data.
Back in 2008, when we were working on what became one of the first papers on big data technologies, one of our first visits was to LinkedIn’s new “data” team. Many of the members of that team went on to build interesting tools and products, and team manager DJ Patil emerged as one of the best-known data scientists. I recently sat down with Patil to talk about his new ebook (written with Hilary Mason) and other topics in data science and big data.
Subscribe to the O’Reilly Data Show Podcast
Here are a few of the topics we touched on:
Proliferation of programs for training and certifying data scientists
Patil and I are both ex-academics who learned learned “data science” in industry. In fact, up until a few years ago one acquired data science skills via “on-the-job training.” But a new job title that catches on usually leads to an explosion of programs (I was around when master’s programs in financial engineering took off). Are these programs the right way to acquire the necessary skills? Read more…
Lessons from next-generation data wrangling tools
Drawing inspiration from recent advances in data preparation.

One of the trends we’re following is the rise of applications that combine big data, algorithms, and efficient user interfaces. As I noted in an earlier post, our interest stems from both consumer apps as well as tools that democratize data analysis. It’s no surprise that one of the areas where “cognitive augmentation” is playing out is in data preparation and curation. Data scientists continue to spend a lot of their time on data wrangling, and the increasing number of (public and internal) data sources paves the way for tools that can increase productivity in this critical area.
At Strata + Hadoop World New York, NY, two presentations from academic spinoff start-ups — Mike Stonebraker of Tamr and Joe Hellerstein and Sean Kandel of Trifacta — focused on data preparation and curation. While data wrangling is just one component of a data science pipeline, and granted we’re still in the early days of productivity tools in data science, some of the lessons these companies have learned extend beyond data preparation.
Scalability ~ data variety and size
Not only are enterprises faced with many data stores and spreadsheets, data scientists have many more (public and internal) data sources they want to incorporate. The absence of a global data model means integrating data silos, and data sources requires tools for consolidating schemas.
Random samples are great for working through the initial phases, particularly while you’re still familiarizing yourself with a new data set. Trifacta lets users work with samples while they’re developing data wrangling “scripts” that can be used on full data sets.
Read more…