
Training in the big data ecosystem
The O'Reilly Radar Podcast: Paco Nathan and Jesse Anderson on the evolution of the data training landscape.
Subscribe to the O’Reilly Radar Podcast to track the technologies and people that will shape our world in the years to come.
 In this week’s Radar Podcast, O’Reilly’s Ben Lorica talks to Paco Nathan, director of O’Reilly Learning, and Jesse Anderson, technical trainer and creative engineer at Confluent.
Their discussion focuses on the training landscape in the big data ecosystem, their teaching techniques and particular content they choose, and a look at some expected future trends.
Here are a few snippets from their chat:
Training vs PowerPoint slides
Anderson: “Often, when you have a startup and somebody says, ‘Well, we need some training,’ what will usually happen is one of the software developers will say, ‘OK, I’ve done some training in the past and I’ll put together some PowerPoints.’ The differences between a training thing and doing some PowerPoints, like at a meetup, is that a training actually has to have hands-on exercises. It has to have artifacts that you use right there in class. You actually need to think through, these are concepts, these are things that the person will need to be successful in that project. It really takes a lot of time and it takes some serious expertise and some experience in how to do that.”
Nathan: “Early on, you would get some committer to go out and do a meetup, maybe talk about an extension to an API or whatever they were working on directly. If there was a client firm that came up and needed training, then they’d peel off somebody. As it evolved, that really didn’t work. That kind of model doesn’t scale. The other thing too is, you really do need people who understand instructional design, who really understand how to manage a classroom. Especially when it gets to any size, it’s not just a afterthought for an engineer to handle.” Read more…

Building enterprise data applications with open source components
The O’Reilly Data Show podcast: Dean Wampler on bounded and unbounded data processing and analytics.
Subscribe to the O’Reilly Data Show Podcast to explore the opportunities and techniques driving big data and data science.

I first found myself having to learn Scala when I started using Spark (version 0.5). Prior to Spark, I’d peruse books on Scala but just never found an excuse to delve into it. In the early days of Spark, Scala was a necessity — I quickly came to appreciate it and have continued to use it enthusiastically.
For this Data Show Podcast, I spoke with O’Reilly author and Typesafe’s resident big data architect Dean Wampler about Scala and other programming languages, the big data ecosystem, and his recent interest in real-time applications. Dean has years of experience helping companies with large software projects, and over the last several years, he’s focused primarily on helping enterprises design and build big data applications.
Here are a few snippets from our conversation:
Apache Mesos & the big data ecosystem
It’s a very nice capability [of Spark] that you can actually run it on a laptop when you’re developing or working with smaller data sets. … But, of course, the real interesting part is to run on a cluster. You need some cluster infrastructure and, fortunately, it works very nicely with YARN. It works very nicely on the Hadoop ecosystem. … The nice thing about Mesos over YARN is that it’s a much more flexible, capable resource manager. It basically treats your cluster as one giant machine of resources and gives you that illusion, ignoring things like network latencies and stuff. You’re just working with a giant machine and it allocates resources to your jobs, multiple users, all that stuff, but because of its greater flexibility, it cannot only run things like Spark jobs, it can run services like HDFS or Cassandra or Kafka or any of these tools. … What I saw was there was a situation here where we had maybe a successor to YARN. It’s obviously not as mature an ecosystem as the Hadoop ecosystem but not everybody needs that maturity. Some people would rather have the flexibility of Mesos or of solving more focused problems.

Major players and important partnerships in the big data market
A fully data-driven market report maps and analyzes the intersections between companies.
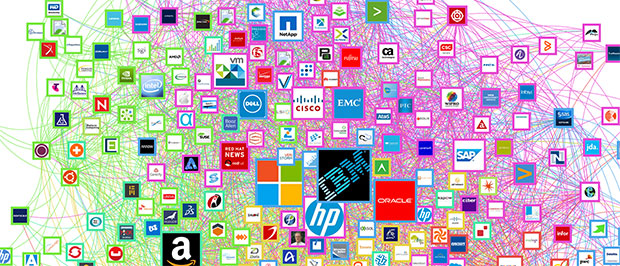
Download our new free report “Mapping Big Data: A Data Driven Market Report” for insights into the shape and structure of the big data market.
Who are the major players in the big data market? What are the sectors that make up the market and how do they relate? Which among the thousands of partnerships are most important?
These are just a handful of questions we explore in-depth in the new O’Reilly report now available for free download: Mapping Big Data: A Data Driven Market Report. For this new report, San Francisco-based startup Relato mapped the intersection of companies throughout the data ecosystem — curating a network with tens of thousands of nodes and edges representing companies and partnerships in the big data space.
Relato created the network by extracting data from company home pages on the Web and analyzed it using social network analysis; market experts interpreted the results to yield the insights presented in the report. The result is a preview of the future of market reports. Read more…

Improving corporate planning through insight generation
Data storage and management providers are becoming key contributors for insight as a service.
 Contrary to what many believe, insights are difficult to identify and effectively apply. As the difficulty of insight generation becomes apparent, we are starting to see companies that offer insight generation as a service.
Data storage, management and analytics are maturing into commoditized services, and the companies that provide these services are well-positioned to provide insight on the basis not just of data, but data access and other metadata patterns.
Companies like DataHero and Host Analytics [full disclosure: Host Analytics is one of my portfolio companies] are paving the way in the insight-as-a-service space. Host Analytics’ initial product offering was a cloud-based Enterprise Performance Management (EPM) Suite, but far more important is what they are now enabling for the enterprise: they have moved from being an EPM company to being an insight generation company. In this post, I will discuss a few of the trends that have enabled insight as a service (IaaS) and discuss the general case of using a software-as-a-service (SaaS) EPM solution to corral data and deliver insight as a service as the next level of product.
Insight generation is the identification of novel, interesting, plausible and understandable relations among elements of a data set that a) lead to the formation of an action plan and b) result in an improvement as measured by a set of KPIs. The evaluation of the set of identified relations to establish an insight, and the creation of an action plan associated with a particular insight or insights, needs to be done within a particular context and necessitates the use of domain knowledge. Read more…

Integrate, catalog, and preserve metadata
Dr. Clare Bernard, former particle physicist at CERN, on solutions for discovering, organizing, and visualizing enterprise data.

During a special edition of The O’Reilly Podcast, host and O’Reilly chief data scientist Ben Lorica interviewed Dr. Clare Bernard, a former particle physicist at CERN, who worked on the ATLAS experiment at the Large Hadron Collider. Bernard is now a field engineer at Tamr, where she’s involved in a new project that aims to integrate and catalog a variety of data across an enterprise, while preserving metadata.
Key takeaways from their chat:
- A lot of companies have big top-down master data management projects, and they put in place a lot of data-governance tools, which typically don’t scale very well.
- It’s really important to track where the data came from, what the fields mean, and what transformations have been applied to that data over time, so that you can then use it for your analytics and you really understand what it means.
- Tracking metadata allows you to reproduce your data pipelines, and understand the lineage, and provenance of your data.
Ben Lorica: Let’s start with a little bit about your background. You are a scientist by training, right?
Clare Bernard: Yes. I was a particle physicist. I worked at CERN for a couple years and worked on the ATLAS experiment at the Large Hadron Collider. Then I got my Ph.D. and graduated in May. I’ve been working at Tamr since then, as a field engineer. Read more…

2015 Data Science Salary Survey
Revealing patterns in tools, tasks, and compensation through clustering and linear models.
Download the free “2015 Data Science Salary Survey” report to learn about tools, trends, and what pays (and what doesn’t) for data professionals.
Data scientists are constantly looking outward, tapping into and extracting information from all manner of data in ways hardly imaginable not long ago. Much of the change is technological — data collection has multiplied as well as our means of processing it — but an important cultural shift has played a part, too, evidenced by the desire of organizations to become “data-driven” and the wide availability of public APIs.
But how much do we look inward, at ourselves? The variety of data roles, both in subject and method, means that even those of us who have a strong grasp of what it means to be a data scientist in a particular domain or sub-field may not have a complete view of the data space as a whole. Just as data we process and analyze for our organizations can be used to decide business actions, data about data scientists can help inform our career choices.
That’s where we come in. O’Reilly Media has been conducting an annual survey for data professionals, asking questions primarily about tools, tasks, and salary — and we are now releasing the third installment of the associated report, the 2015 Data Science Salary Survey. The 2015 edition features a completely new graphic design of the report and our findings. In addition to estimating salary differences based on demographics and tool usage, we have given a more detailed look at tasks — how data professionals spend their workdays — and titles. Read more…