O'Reilly Strata
There’s More Than One Kind of Data Scientist
Results from a survey of analytics professionals
 Analyzing the Analyzers: An Introspective Survey of Data Scientists and their Work is the result of applying the methods of data science to our own professional community. My co-authors (Sean Murphy and Marck Vaisman) and I run professional Meetup groups for statistical and analytics professionals in the Washington, DC area. In the course of organizing Data Science DC, Data Business DC, Statistical Programming DC, and serving on the board of Data Community DC, we meet a lot of people, many of whom either call themselves “data scientists” or aspire to do so. But these people have substantially different education, experiences, aptitudes, and attitudes. Why are they all using the same label?
We believe that this new job title or career path of “data science” came about because people were dissatisfied with existing ways of describing their roles and their work. But is everyone converging on “data scientist” progress, or is it just a source of confusion?
In the Spring of 2012, we observed that this new, vaguely-defined career, although tremendously exciting and fulfilling for all of us, was impaired by unclear communication, unrealistic expectations, and missed opportunities. Something had to be done. As data scientists, we thought that a natural way to bring more clarity to the issue would be to collect some data, so we developed a survey and recruited hundreds of participants. Our analysis focused on finding underlying explanatory structure in the results that would let us help to improve communication, expectations, and opportunities for and about data scientists.
Every leader has their “how I got here” story
Opportunity to share your data stories with Brett Goldstein and Q. Ethan McCallum
On Goldstein, McCallum, and their upcoming book, Making Analytics Work: Case by Case
By Alex Howard

Alex Howard
People have been crunching numbers to understand government since the first time an official used an abacus to compare one season’s grain harvest against another. Tracking and comparing data is part of how we’ve been understanding our world for millennia. In the 21st century, organizations in all sectors are transitioning from paper records to massive databases. Instead of inscribing tablets, we’re browsing real-time data dashboards on them. Using modern data analytics to make sense of all of those numbers is now the task of scientists, journalists and, intriguingly, public officials. That’s the context in which I first encountered Brett Goldstein, when I talked with him about his work as Chicago’s chief data officer. Goldstein has been a key part of Chicago’s data-driven approach to open government since Mayor Rahm Emanuel was elected in February 2011. He and Chicago CTO John Tolva have been breaking new ground in an emerging global discussion around how cities understand, govern and regulate themselves.
I saw Goldstein share his ideas for data analytics in person at last year’s Strata Conference in New York City, where he and Q Ethan McCallum, the author of the Bad Data Handbook, talked about text mining and civic engagement. Their thinking on big data in the public sector is helping to inform other cities that want to follow in Chicago’s footsteps. Urban predictive analytics are making sense of what residents are doing, where and when — and what they want from their governments. Both men have steadily built and earned excellent reputations as a public servant and a trusted authority in in the field.
Four steps to analyzing big data with Spark
By Andy Konwinski, Ion Stoica, and Matei Zaharia
In the UC Berkeley AMPLab, we have embarked on a six year project to build a powerful next generation big data analytics platform: the Berkeley Data Analytics Stack (BDAS). We have already released several components of BDAS including Spark, a fast distributed in-memory analytics engine, and in February we ran a sold out tutorial at the Strata conference in Santa Clara teaching attendees how to use Spark and other components of the BDAS stack.
In this blog post we will walk through four steps to getting hands-on using Spark to analyze real data. For an overview of the motivation and key components of BDAS, check out our previous Strata blog post.
Why? Why? Why!
A lesson for data science teams.
By Dean Malmgren and Mike Stringer
The other day we had a conversation with a bespectacled senior data scientist at another organization (named X to protect the innocent). The conversation went something like this:
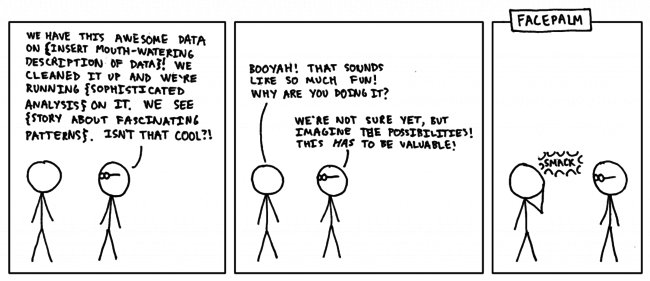
Many of us have had similar conversations with people like X, and many of us have even been X before. Data scientists, being curious individuals, enjoy working on problems for the sake of doing something interesting, fun, technically challenging, or because their boss heard about “big data” in the Wall Street Journal. These reasons are all distinctly different from trying to solve an important problem.
Large-Scale Data Collection and Real-Time Analytics Using Redis
Insights from a Strata Santa Clara 2013 session
Strata Santa Clara 2013 is a wrap, and I had a great time speaking and interacting with all of the amazing attendees. I’d like to recap the talk that Tim Palko and I gave, entitled “Large-Scale Data Collection and Real-Time Analytics Using Redis”, and maybe even answer a few questions we were asked following our time on stage.
Our talk centered around a system we designed to collect environmental sensor data from remote sensors located in various places across the country and provide real-time visualization, monitoring, and event detection. Our primary challenge for the initial phase of development proved to be scaling the system to collect data from thousands of nodes, each of which sent sensor readings roughly once per second, which maintaining the ability to query the data in real time for event detection. While each data record was only ~300kb, our expected maximum sensor load indicated a collection rate of about 27 million records, or 8GB, per hour. However, our primary issue was not data size, but data rate. A large number of inserts had to happen each second, and we were unable to buffer inserts into batches or transactions without incurring a delay in the real-time data stream.
Returning transactions to distributed data stores
Principles for the next generation of NoSQL databases
By David Rosenthal and Stephen Pimentel
Rise of NoSQL
Database technologies are undergoing rapid evolution, with new approaches being actively explored after decades of relative stability. As late as 2008, the term “NoSQL” barely existed and relational databases were both commercially dominant and entrenched in the developer community. Since then NoSQL systems have rapidly gained prominence and early systems such as Google’s Bigtable and Amazon’s Dynamo have inspired dozens of new databases (HBase, Cassandra, Voldemort, MongoDB, etc.) that fall under the NoSQL umbrella.
The first generation of NoSQL databases aimed to achieve the dual goals of fault tolerance and horizontal scalability on clusters of commodity hardware There are now a variety of NoSQL systems available that, at their best, achieve these goals. Unfortunately, the cost for these benefits is high: limited data model flexibility and extensibility, and weak guarantees for applications due to the lack of multi-statement (global) transactions.
Tips and Tricks for Debugging Distributed Systems
Preview of upcoming session at the Strata Conference
I’m talking on Wednesday at Strata about Tips and Tricks for Debugging Distributed Systems. You should come check it out.
As a preview, let’s talk about two pretty pictures.
Network Visualization

I’m running some typical distributed systems (HDFS, MapReduce, Impala, HBase, Zookeeper) on a small, seven-node cluster. The diagram above has individual processes and the TCP connections they’ve established to each other. Some processes are “masters” and they end up talking to many other processes.
Sketching techniques for real-time big data
Preview of an upcoming session at Strata Santa Clara

Bahman Bahmani
In many modern web and big data applications the data arrives in a streaming fashion and needs to be processed on the fly. In these applications, the data is usually too large to fit in main memory, and the computations need to be done incrementally upon arrival of new pieces of data. Sketching techniques allow these applications to be realized with high levels of efficiency in memory, computation, and network communications.
In the algorithms research community, sketching techniques first appeared in the literature in 1980s, e.g., in the seminal work of Philippe Flajolet and G. Nigel Martin, then caught attentions in late 1990s, partially inspired by the award-winning work of Noga Alon, Yossi Matias, and Mario Szegedy, and were/are on fire in 2000’s/2010’s, when sketches got successfully designed not only for fundamental problems such as heavy hitters, but also for matrix computations, network algorithms, and machine learning. These techniques are now at an inflection point in the course of their history, due to the following factors:
1. Untapped potential: Being so new, their huge practical potential has been yet barely tapped into.
2. Breadth and maturity: They are now both broad and mature enough to start to be widely used across a variety of big data applications, and even act as basic building blocks for new highly efficient big data management systems.
Who do you trust? You are surrounded by bots.
Preview of upcoming session "Who is Fake?" at the Strata Conference
By Lutz Finger
In the Matrix, the idea of a computer algorithm determining what we think may seemed far-fetched. Really? Far-fetched? Let’s look at some numbers.
About half of all Americans get their news in digital form. This news is written up by journalists, half of whom at least partially source their stories from social media. They use tools to harvest the real time knowledge of 100,000 tweets per second and more.
But what if someone could influence those tools and create messages that look as though they were part of a common consensus? Or create the appearance of trending?
Keep your data science efforts from derailing
Preview of upcoming session at Strata Santa Clara
By Marck Vaisman and Sean Murphy
Is your organization considering embracing data science? If so, we would like to give you some helpful advice on organizational and technical issues to consider before you embark on any initiatives or consider hiring data scientists. Join us, Sean Murphy and Marck Vaisman, two Washington, D.C. based data scientists and founding members of Data Community DC, as we walk you through the trials and tribulations of practicing data scientists at our upcoming talk at Strata.
We will discuss anecdotes and best practices, and finish by presenting the results of a survey we conducted last year to help understand the varieties of people, skills, and experiences that fall under the broad term of “Data Scientist”. We analyzed data from over 250 survey respondents, and are excited to share our findings, which will also be published soon by O’Reilly.