"Big Data and Cognitive Augmentation" entries

There are many use cases for graph databases and analytics
Business users are becoming more comfortable with graph analytics.
 The rise of sensors and connected devices will lead to applications that draw from network/graph data management and analytics. As the number of devices surpasses the number of people — Cisco estimates 50 billion connected devices by 2020 — one can imagine applications that depend on data stored in graphs with many more nodes and edges than the ones currently maintained by social media companies.
This means that researchers and companies will need to produce real-time tools and techniques that scale to much larger graphs (measured in terms of nodes & edges). I previously listed tools for tapping into graph data, and I continue to track improvements in accessibility, scalability, and performance. For example, at the just-concluded Spark Summit, it was apparent that GraphX remains a high-priority project within the Spark1 ecosystem.

Untapped opportunities in AI
Some of AI's viable approaches lie outside the organizational boundaries of Google and other large Internet companies.

Editor’s note: this post is part of an ongoing series exploring developments in artificial intelligence.
Here’s a simple recipe for solving crazy-hard problems with machine intelligence. First, collect huge amounts of training data — probably more than anyone thought sensible or even possible a decade ago. Second, massage and preprocess that data so the key relationships it contains are easily accessible (the jargon here is “feature engineering”). Finally, feed the result into ludicrously high-performance, parallelized implementations of pretty standard machine-learning methods like logistic regression, deep neural networks, and k-means clustering (don’t worry if those names don’t mean anything to you — the point is that they’re widely available in high-quality open source packages).
Google pioneered this formula, applying it to ad placement, machine translation, spam filtering, YouTube recommendations, and even the self-driving car — creating billions of dollars of value in the process. The surprising thing is that Google isn’t made of magic. Instead, mirroring Bruce Scheneier’s surprised conclusion about the NSA in the wake of the Snowden revelations, “its tools are no different from what we have in our world; it’s just better funded.” Read more…
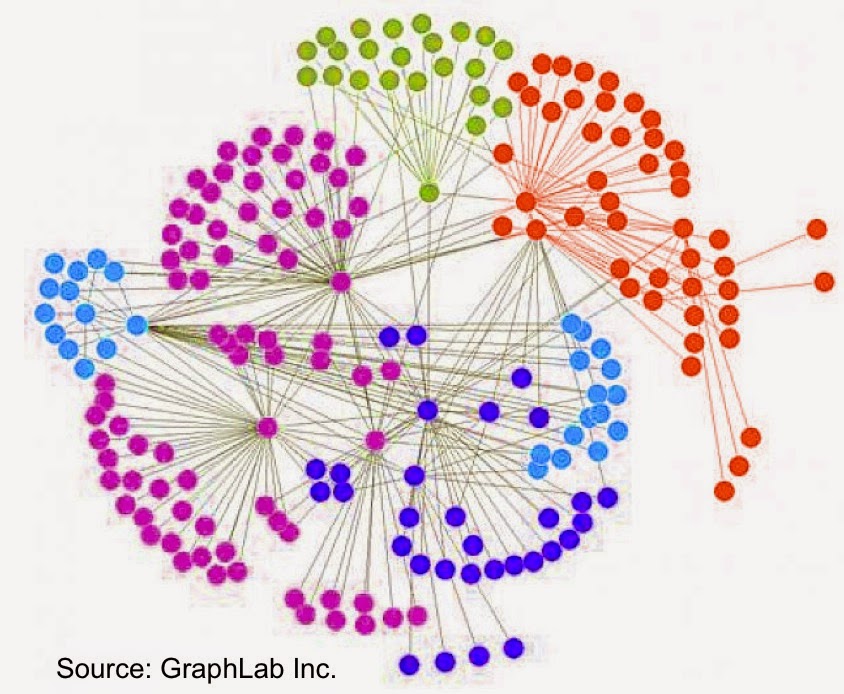
Network Science dashboards
Networks graphs can be used as primary visual objects with conventional charts used to supply detailed views
With Network Science well on its way to being an established academic discipline, we’re beginning to see tools that leverage it. Applications that draw heavily from this discipline make heavy use of visual representations and come with interfaces aimed at business users. For business analysts used to consuming bar and line charts, network visualizations take some getting used. But with enough practice, and for the right set of problems, they are an effective visualization model.
In many domains, networks graphs can be the primary visual objects with conventional charts used to supply detailed views. I recently got a preview of some dashboards built using Financial Network Analytics (FNA). Read more…

#IoTH: The Internet of Things and Humans
The IoT requires thinking about how humans and things cooperate differently when things get smarter.
Rod Smith of IBM and I had a call the other day to prepare for our onstage conversation at O’Reilly’s upcoming Solid Conference, and I was surprised to find how much we were in agreement about one idea: so many of the most interesting applications of the Internet of Things involve new ways of thinking about how humans and things cooperate differently when the things get smarter. It really ought to be called the Internet of Things and Humans — #IoTH, not just #IoT!
Let’s start by understanding the Internet of Things as the combination of sensors, a network, and actuators. The “wow” factor — the magic that makes us call it an Internet of Things application — can come from creatively amping up the power of any of the three elements.
For example, a traditional “dumb” thermostat consists of only a sensor and an actuator — when the temperature goes out of the desired range, the heat or air conditioning goes on. The addition of a network, the ability to control your thermostat from your smartphone, say, turns it into a simple #IoT device. But that’s the bare-base case. Consider the Nest thermostat: where it stands out from the crowd of connected thermostats is that it uses a complex of sensors (temperature, moisture, light, and motion) as well as both onboard and cloud software to provide a rich and beautiful UI with a great deal more intelligence. Read more…

Visualizing Health IT: A holistic overview
O'Reilly report covers major trends and tries to connect the neurons
If visualization is key to comprehending data, the field of health IT calls for better visualization. I am not talking here of pretty charts and animations. I am talking, rather, of a holistic, unified understanding of the bustle taking place in different corners of health: the collection and analysis of genetic data, the design of slim medical devices that replace refrigerator-sized pieces of equipment, the data crunching at hospitals delving into demographic data to identify at-risk patients.
There is no dearth of health reformers offering their visions for patient engagement, information exchange, better public health, and disruptive change to health industries. But they often accept too freely the promise of technology, without grasping how difficult the technical implementations of their reforms would be. Furthermore, no document I have found pulls together the various trends in technology and explores their interrelationships.
I have tried to fill this gap with a recently released report: The Information Technology Fix for Health: Barriers and Pathways to the Use of Information Technology for Better Health Care. This posting describes some of the issues it covers.
Financial analytics as a service
Analytic services are tailoring their solutions for specific problems and domains
In relatively short order Amazon’s internal computing services has become the world’s most successful cloud computing platform. Conceived in 2003 and launched in 2006, AWS grew quickly and is now the largest web hosting company in the world. With the recent addition of Kinesis (for stream processing), AWS continues to add services and features that make it an attractive platform for many enterprises.
A few other companies have followed a similar playbook: technology investments that benefit a firm’s core business, is leased out to other companies, some of whom may operate in the same industry. An important (but not well-known) example comes from finance. A widely used service provides users with clean, curated data sets and sophisticated algorithms with which to analyze them. It turns out that the world’s largest asset manager makes its investment and risk management systems available to over 150 pension funds, banks, and other institutions. In addition to the $4 trillion managed by BlackRock, the company’s Aladdin Investment Management system is used to manage1 $11 trillion in additional assets from external managers.