"Big Data Design and Social Science" entries

Telling your data’s story
How storytelling can enhance the effectiveness of your visualizations.
Editor’s note: this post is part of our investigation into Big Data Design and Social Science. Michael Freeman covers the use of storytelling frameworks in visualizations in his new tutorial video “Using Storytelling to Effectively Communicate Data.”
Visualizing complex relationships in big data often requires involved graphical displays that can be intimidating to users. As the volume and complexity of data collection and storage scale exponentially, creating clear, communicative, and approachable visual representations of that data is an increasing challenge. As a data visualization specialist, I frightened one of my first sets of collaborators when I suggested using this display:
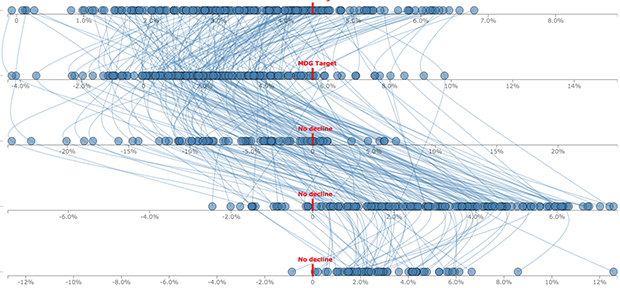
What I had failed to communicate was that we would use a story structure to introduce audiences to the complex layout (you can see how I did it here).
This image captures three emerging limitations in big data visualization:
- Unclear visual encodings: People don’t know what each visual symbol represents
- Too much data: The volume of information displayed is overwhelming
- Too many variables: Simultaneous encodings of color, position, size, etc. precludes fully understanding each dimension

Data APIs, design, and visual storytelling
One example of how using a data API can lead to better visualizations.

Over the past five years, international agencies such as the World Bank, OECD, and UNESCO have created portals to make their data available for everyone to explore. Many non-profits are also visualizing masses of data in the hope that it will give policymakers, funders, and the general public a better understanding of the issues they are trying to solve.
Data visualization plays a key role in telling the stories behind the data. For most audiences, data sets are hard to use and interpret — the average user will need a technical guide just to navigate through the complicated hierarchies of categories let alone interpret the information. But data visualizations trigger interest and insight because they are immediate, clear, and tangible.
At FFunction, we visualize a lot of data. Most of the time our clients send us Excel spreadsheets or CSV files, so we were happily surprised when we started to work with UNESCO Institute for Statistics on two fascinating education-related projects — Out-of-School Children and Left Behind — and realized that they had been working on a data API. As we began to work through the data ourselves, we uncovered several reasons why using an API helps immeasurably with data visualization. Read more…

Big data’s impact on global agriculture
The O'Reilly Radar Podcast: Stewart Collis talks about making precision farming accessible and affordable for all farmers.

Stewart Collis, CTO and co-founder of AWhere, recently tweeted a link to a video by the University of Minnesota’s Institute on the Environment, Big Question: Feast or Famine? The video highlights the increasing complexity of feeding our rapidly growing population, and Collis noted its relation to his work at AWhere. I recently caught up with Collis to talk about our current global agriculture situation, the impact of big data on agriculture, and the work his company is doing to help address global agriculture problems.
The challenge, explained Collis, is two-fold: our growing population — expected to increase by another 2.4 billion people by 2050, and the increasing weather variability affecting our growing seasons and farmers’ abilities to produce and scale to accommodate that population. “In the face of weather variability, climate change, and increasing temperatures … farmers no longer know when it’s going to rain,” he said, and then noted: “There’s only 34 growing seasons between now and [2050], so this is a problem we need to solve now.”
An alternate perspective on data-driven decision making
The O'Reilly Radar Podcast: Tricia Wang on "thick data," purpose-driven problem solving, and building the ideal team.
In this week’s Radar Podcast episode, O’Reilly’s Roger Magoulas chatted with Tricia Wang, a global tech ethnographer and co-founder of PL Data, about how qualitative and quantitative data need to work together, reframing “data-driven decision making,” and building the ideal team.
Purpose-driven problem solving
Wang stressed that quantitative and qualitative need to work together. Rather than focusing on data-driven decision making, we need to focus on the best way to identify and solve the problem at hand: the data alone won’t provide the answers:
“It’s been kind of a detriment to our field that there’s this phrase ‘data-driven decision making.’ I think oftentimes people expect that the data’s going to give you answers. Data does not give you answers; it gives you inputs. You still have to figure out how to do the translation work and figure out what the data is trying to explain, right? I think data-driven decision making does not accurately describe what data can do. Really what we should be talking about is purpose-driven problem solving with data. Read more…

How data and connectivity are changing the nature of play
Now that technology has made its way into the playroom, there are a lot of important questions we should be asking.

Sign up to be notified when the new free report Data, Technology & The Future of Play becomes available. This post is part of a series investigating the future of play that will culminate in a full report.
Playing is how we learn. Through play, we develop large and fine motor skills, refine language and social interaction, and discover important facts about everything from the cycle of life and death to the laws of physics. When we play, we test the world around us, and share and grow.
But play is changing because it’s now filled with technology. In the coming months, I’m going to be looking at how data and connectivity are changing toys and the very nature of play. I’ll be talking to designers, inventors, technologists, and educators, and publishing the results in a report for O’Reilly Media.
Here’s my thinking so far:
Until very recent times, play was a purely tangible, real-world experience. Almost every adult alive has built a tower of blocks, climbed something, chased another person, used a skipping rope, and put together a puzzle. We all know the rules of tag and hide and seek. Some of our fondest memories include creative and imaginative play. We were pirates. We were princesses. We were explorers in a new, exciting land, limited only by our own imaginations and the loving cry of parents calling us home for dinner. Read more…

Forecasting events, from disease outbreaks to sales to cancer research
The O'Reilly Data Show Podcast: Kira Radinsky on predicting events using machine learning, NLP, and semantic analysis.
Editor’s note: One of the more popular speakers at Strata + Hadoop World, Kira Radinsky was recently profiled in the new O’Reilly Radar report, Women in Data: Cutting-Edge Practitioners and Their Views on Critical Skills, Background, and Education.
When I first took over organizing Hardcore Data Science at Strata + Hadoop World, one of the first speakers I invited was Kira Radinsky. Radinsky had already garnered international recognition for her work forecasting real-world events (disease outbreak, riots, etc.). She’s currently the CTO and co-founder of SalesPredict, a start-up using predictive analytics to “understand who’s ready to buy, who may buy more, and who is likely to churn.”
I recently had a conversation with Radinsky, and she took me through the many techniques and subject domains from her past and present research projects. In grad school, she helped build a predictive system that combined newspaper articles, Wikipedia, and other open data sets. Through fine-tuned semantic analysis and NLP, Radinsky and her collaborators devised new metrics of similarity between events. The techniques she developed for that predictive software system are now the foundation of applications across many areas. Read more…
Network structure and dynamics in online social systems
Understanding information cascades, viral content, and significant relationships.

I rarely work with social network data, but I’m familiar with the standard problems confronting data scientists who work in this area. These include questions pertaining to network structure, viral content, and the dynamics of information cascades.
At last year’s Strata + Hadoop World NYC, Cornell Professor and Nevanlinna Prize Winner Jon Kleinberg walked the audience through a series of examples from social network analysis, looking at the content of shared photos and text, as well as the structures of the networks. It was a truly memorable presentation from one of the foremost experts in network analysis. Each of the problems he discussed would be of interest to marketing professionals, and the analytic techniques he described were accessible to many data scientists. What struck me is that while these topics are easy to describe, framing the right question requires quite a bit of experience with the underlying data.
Predicting whether an information cascade will double in size
Can you predict if a piece of information (say a photo) will be shared only a few times or hundreds (if not thousands) of times? Large cascades are very rare, making the task of predicting eventual size difficult. You either default to a pathological answer (after all most pieces of information are shared only once), or you create a balanced data set (comprised of an equal number of small and large cascades) and end up solving an artificial task.
Thinking of a social network as an information transport layer, Kleinberg and his colleagues instead set out to track the evolution of cascades. In the process, they framed an interesting balanced algorithmic prediction problem: given a cascade of size k, predict whether it will reach size 2k (it turns out 2k is roughly the median size of a cascade conditional on whether it reaches size k). Read more…
A human-centered approach to data-driven design
The O'Reilly Radar Podcast: Arianna McClain on humanizing data-driven design, and Dirk Knemeyer on design in emerging tech.
This week on the O’Reilly Radar Podcast, O’Reilly’s Roger Magoulas talks with Arianna McClain, a senior hybrid design researcher at IDEO, about storytelling through data; the interdependent nature of qualitative and quantitative data; and the human-centered, data-driven design approach at IDEO.
In their interview, Magoulas noted that in our research at O’Reilly, we’ve been talking a lot about the importance of the social science design element in getting the most out of data. McClain emphasized the importance of storytelling through data at IDEO and described IDEO’s human-centered approach to data-driven design:
“IDEO really believes in staying and remaining human-centered throughout the data journey. Starting off with, how might we measure something, how might we measure a behavior. We don’t sit in a room and come up with an algorithm or come up with a question. We start by talking to people. … We’re trying to build measures and survey questions to understand at scale how people make decisions. … IDEO remains data-driven to how we analyze and synthesize our findings. When we’re given a large data set, we don’t analyze it and write a report and give it to people and say, ‘This is the direction we think you should go.’
“Instead, we look at segmentations in the data, and stories in the data, and how the data clusters. Then we go back, and we try to find people who are representative of that cluster or that segmentation. The segmentations, again, are not based on demographic variables. They are based on needs and insights that we heard in our qualitative research. … What we’ve recognized is that something that seems so clear in the analysis is often very nuanced, and it can inform our design.”

Now available: Big Data Now, 2014 edition
Our wrap-up of important developments in the big data field.
- Cognitive augmentation: As data processing and data analytics become more accessible, jobs that can be automated will go away. But to be clear, there are still many tasks where the combination of humans and machines produce superior results.
- Intelligence matters: Artificial intelligence is now playing a bigger and bigger role in everyone’s lives, from sorting our email to rerouting our morning commutes, from detecting fraud in financial markets to predicting dangerous chemical spills. The computing power and algorithmic building blocks to put AI to work have never been more accessible.
A brief look at data science’s past and future
In this O'Reilly Data Show Podcast: DJ Patil weighs in on a wide range of topics in data science and big data.
Back in 2008, when we were working on what became one of the first papers on big data technologies, one of our first visits was to LinkedIn’s new “data” team. Many of the members of that team went on to build interesting tools and products, and team manager DJ Patil emerged as one of the best-known data scientists. I recently sat down with Patil to talk about his new ebook (written with Hilary Mason) and other topics in data science and big data.
Subscribe to the O’Reilly Data Show Podcast
Here are a few of the topics we touched on:
Proliferation of programs for training and certifying data scientists
Patil and I are both ex-academics who learned learned “data science” in industry. In fact, up until a few years ago one acquired data science skills via “on-the-job training.” But a new job title that catches on usually leads to an explosion of programs (I was around when master’s programs in financial engineering took off). Are these programs the right way to acquire the necessary skills? Read more…