"Big Data Tools and Pipelines" entries

Real-time, not batch-time, analytics with Hadoop
How big data, fast data, and real-time analytics work together in the real world.
Attend the VoltDB webcast on June 24, 2015 with John Hugg to learn more on how to build a fast data front-end to Hadoop.
Today, we often hear the phrase “The 3 Vs” in relation to big data: Volume, Variety and Velocity. With the interest and popularity of big data frameworks such as Hadoop, the focus has mostly centered on volume and data at rest. Common requirements here would be data ingestion, batch processing, and distributed queries. These are well understood. Increasingly, however, there is a need to manage and process data as it arrives, in real time. There may be great value in the immediacy of that data and the ability to act upon it very quickly. This is velocity and data in motion, also known as “fast data.” Fast data has become increasingly important within the past few years due to the growth in endpoints that now stream data in real time.
Big data + fast data is a powerful combination. However, adding real-time analytics to this mix provides the business value. Let’s look at a real example, originally described by Scott Jarr of VoltDB.
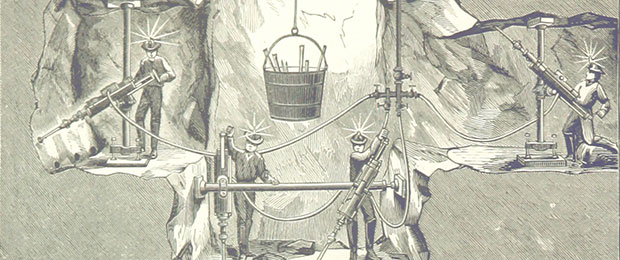
Consider a company that builds systems to manage physical assets in precious metal mines. Inside a mine, there are sensors on miners as well as shovels and other assets. For a lost shovel, minutes or hours of reporting latency may be acceptable. However, a sensor on a miner indicating a stopped heart should require immediate attention. The system should, therefore, be able to receive very fast data. Read more…

Building self-service tools to monitor high-volume time-series data
The O'Reilly Data Show Podcast: Phil Liu on the evolution of metric monitoring tools and cloud computing.
One of the main sources of real-time data processing tools is IT operations. In fact, a previous post I wrote on the re-emergence of real-time, was to a large extent prompted by my discussions with engineers and entrepreneurs building monitoring tools for IT operations. In many ways, data centers are perfect laboratories in that they are controlled environments managed by teams willing to instrument devices and software, and monitor fine-grain metrics.
During a recent episode of the O’Reilly Data Show Podcast, I caught up with Phil Liu, co-founder and CTO of SignalFx, a SF Bay Area startup focused on building self-service monitoring tools for time series. We discussed hiring and building teams in the age of cloud computing, building tools for monitoring large numbers of time series, and lessons he’s learned from managing teams at leading technology companies.
Evolution of monitoring tools
Having worked at LoudCloud, Opsware, and Facebook, Liu has seen first hand the evolution of real-time monitoring tools and platforms. Liu described how he has watched the number of metrics grow, to volumes that require large compute clusters:
One of the first services I worked on at LoudCloud was a service called MyLoudCloud. Essentially that was a monitoring portal for all LoudCloud customers. At the time, [the way] we thought about monitoring was still in a per-instance-oriented monitoring system. [Later], I was one of the first engineers on the operational side of Facebook and eventually became part of the infrastructure team at Facebook. When I joined, Facebook basically was using a collection of open source software for monitoring and configuration, so these are things that everybody knows — Nagios, Ganglia. It started out basically using just per-instance instant monitoring techniques, basically the same techniques that we used back at LoudCloud, but interestingly and very quickly as Facebook grew, this per-instance-oriented monitoring no longer worked because we went from tens or thousands of servers to hundreds of thousands of servers, from tens of services to hundreds and thousands of services internally.

Create your graphs with R
A deep-dive into exploratory and presentation graphs.
Buy “Graphing Data with R: An Introduction” in early release. Editor’s note: this is an excerpt of “Graphing Data with R: An Introduction,” by John Jay Hilfiger.
Graphs are useful both for exploration and for presentation. Exploration is the process of analyzing the data and finding relationships and patterns. Presentation of your findings is making your case to others who have not studied the data as intensively as you have yourself. While one is exploring the data, graphs can be stark, lean, and somewhat unattractive. The data analyst, who knows the data and is getting to know it better with each graph made, does not need all the titles, labels, reference details, and colors that someone sitting through a presentation might expect, and might, indeed, find necessary. Furthermore, adding all this stuff just slows down the analyst. Also, some graphs will prove to be dead ends, or just not very interesting. Consequently, many graphs may be discarded during the discovery journey.As the process of exploration continues, adding some details may make relationships a little clearer. As the analyst gets closer to presentation and/or publication, the graphs become more detailed and prettier. There probably will have been many plain graphs in the process of analysis and relatively few beautiful graphs that appear in the final report. Read more…

Startups suggest big data is moving to the clouds
A look at the winners from a showcase of some of the most innovative big data startups.
At Strata + Hadoop World in London last week, we hosted a showcase of some of the most innovative big data startups. Our judges narrowed the field to 10 finalists, from whom they — and attendees — picked three winners and an audience choice.
Underscoring many of these companies was the move from software to services. As industries mature, we see a move from custom consulting to software and, ultimately, to utilities — something Simon Wardley underscored in his Data Driven Business Day talk, and which was reinforced by the announcement of tools like Google’s Bigtable service offering.
This trend was front and center at the showcase:
- Winner Modgen, for example, generates recommendations and predictions, offering machine learning as a cloud-based service.
- While second-place Brytlyt offers their high-performance database as an on-premise product, their horizontally scaled-out architecture really shines when the infrastructure is elastic and cloud based.
- Finally, third-place OpenSensors’ real-time IoT message platform scales to millions of messages a second, letting anyone spin up a network of connected devices.
Ultimately, big data gives clouds something to do. Distributed sensors need a widely available, connected repository into which to report; databases need to grow and shrink with demand; and predictive models can be tuned better when they learn from many data sets. Read more…

The tensor renaissance in data science
The O'Reilly Data Show Podcast: Anima Anandkumar on tensor decomposition techniques for machine learning.
After sitting in on UC Irvine Professor Anima Anandkumar’s Strata + Hadoop World 2015 in San Jose presentation, I wrote a post urging the data community to build tensor decomposition libraries for data science. The feedback I’ve gotten from readers has been extremely positive. During the latest episode of the O’Reilly Data Show Podcast, I sat down with Anandkumar to talk about tensor decomposition, machine learning, and the data science program at UC Irvine.
Modeling higher-order relationships
The natural question is: why use tensors when (large) matrices can already be challenging to work with? Proponents are quick to point out that tensors can model more complex relationships. Anandkumar explains:
Tensors are higher order generalizations of matrices. While matrices are two-dimensional arrays consisting of rows and columns, tensors are now multi-dimensional arrays. … For instance, you can picture tensors as a three-dimensional cube. In fact, I have here on my desk a Rubik’s Cube, and sometimes I use it to get a better understanding when I think about tensors. … One of the biggest use of tensors is for representing higher order relationships. … If you want to only represent pair-wise relationships, say co-occurrence of every pair of words in a set of documents, then a matrix suffices. On the other hand, if you want to learn the probability of a range of triplets of words, then we need a tensor to record such relationships. These kinds of higher order relationships are not only important for text, but also, say, for social network analysis. You want to learn not only about who is immediate friends with whom, but, say, who is friends of friends of friends of someone, and so on. Tensors, as a whole, can represent much richer data structures than matrices.

The unwelcome guest: Why VMs aren’t the solution for next-gen applications
Scale-out applications need scaled-in virtualization.
 Data center operating systems are emerging as a first-class category of distributed system software. Hadoop, for example, is evolving from a MapReduce framework into YARN, a generic platform for scale-out applications.
To enable a rich ecosystem of diverse applications to coexist on these platforms, providing adequate isolation is crucial. The isolation mechanism must enforce resource limits, decouple software dependencies among applications and the host, provide security and privacy, confine failures, etc. Containers offer a simple and elegant solution to the problem. However, a question that comes up frequently is: Why not virtual machines (VMs)? After all, these systems face a number of the same challenges that have been solved by virtualization for traditional enterprise applications.
All problems in computer science can be solved by another level of indirection, except of course for the problem of too many indirections” — David Wheeler

More tools for managing and reproducing complex data projects
A survey of the landscape shows the types of tools remain the same, but interfaces continue to improve.
As data projects become complex and as data teams grow in size, individuals and organizations need tools to efficiently manage data projects. A while back, I wrote a post on common options, and I closed that piece by asking:
Are there completely different ways of thinking about reproducibility, lineage, sharing, and collaboration in the data science and engineering context?
At the time, I listed categories that seemed to capture much of what I was seeing in practice: (proprietary) workbooks aimed at business analysts, sophisticated IDEs, notebooks (for mixing text, code, and graphics), and workflow tools. At a high level, these tools aspire to enable data teams to do the following:
- Reproduce their work — so they can rerun and/or audit when needed
- Collaborate
- Facilitate storytelling — because in many cases, it’s important to explain to others how results were derived
- Operationalize successful and well-tested pipelines — particularly when deploying to production is a long-term objective
As I survey the landscape, the types of tools remain the same, but interfaces continue to improve, and domain specific languages (DSLs) are starting to appear in the context of data projects. One interesting trend is that popular user interface models are being adapted to different sets of data professionals (e.g. workflow tools for business users). Read more…

How to implement a security data lake
Practical tips for centralizing security data.
But let’s be realistic. You probably have numerous repositories for your security data. Your Security Information and Event Management (SIEM) solution doesn’t scale to the volumes of data that you would really like to collect. This, in turn, makes it hard to use all of your data for any kind of analytics. It’s likely that your tools have to operate on multiple, disconnected data stores that have very different capabilities for data access and analysis. Even worse, during an incident, how many different consoles do you have to touch before you get the complete picture of what has happened? I would guess probably at least four (I would have said 42, but that seemed a bit excessive).
When talking to your peers about this problem, do they tell you to implement Hadoop to deal with the huge data volumes? But what does that really mean — is Hadoop really the solution? After all, Hadoop is a pretty complex ecosystem of tools that requires skilled and expensive people to implement and maintain. Read more…

Coming full circle with Bigtable and HBase
The O'Reilly Data Show Podcast: Michael Stack on HBase past, present, and future.
Subscribe to the O’Reilly Data Show to explore the opportunities and techniques driving big data and data science.
At least once a year, I sit down with Michael Stack, engineer at Cloudera, to get an update on Apache HBase and the annual user conference, HBasecon. Stack has a great perspective, as he has been part of HBase since its inception. As former project leader, he remains a key contributor and evangelist, and one of the organizers of HBasecon.
In the beginning: Search and Bigtable
During the latest episode of the O’Reilly Data Show Podcast, I decided to broaden our conversation to include the beginnings of the very popular Apache HBase project. Stack reminded me that in the early days much of the big data community in the SF Bay Area was centered around search technologies, such as HBase. In particular, HBase was inspired by work out of Google (Bigtable), and the early engineers had ties to projects out of the Internet Archive:
At the time, I was working at the Internet Archive, and I was working on crawlers and search. The Bigtable paper looked really interesting to us because the archive, as you know, we used to host — or still do — the Wayback Machine. The Wayback Machine is a picture of the Web that goes back to 1998, and you could look at the Web at any particular time. What pages looked liked at a particular time. Bigtable was very interesting at the Internet Archive because it had this time dimension.
…
A group had started up to talk about the possibility of implementing a Bigtable clone. It was centered at a place called Powerset, a startup that was in San Francisco back then. That was about doing a search, so I went and talked to them. They said, ‘Come on over and we’ll make a space for doing a Bigtable clone.’ They had a very intricate search pipeline, and it was based on early Amazon AWS, and every time they started up their pipeline, they’d get a phone call from Amazon saying, ‘Please stop whatever it is you’re doing.’ … The first engineer would be a fellow called Jim Kellerman. The actual first 30 classes came from Mike Cafarella. He was instrumental in getting the first versions of Hadoop going. He was hanging around Apache Nutch at the time. … Doug [Cutting] used to work at the Internet archive, and the first actual versions of Hadoop were run on racks at the Internet archive. Doug was working on fulltext search. Then he moved on to go to Yahoo, to work on Hadoop full time.

Squaring big data with database queries
Integrating open source tools into a data warehouse has its advantages.
Although next-gen big data tools such as Hadoop, Spark, and MongoDB are finding more and more uses, most organizations need to maintain data in traditional relational stores as well. Deriving the benefits of both key/value stores and relational databases takes a lot of juggling. Three basic strategies are currently in use.
- Double up on your data storage. Log everything in your fast key/value repository and duplicate part of it (or perform some reductions and store the results) in your relational data warehouse.
- Store data primarily in a relational data warehouse, and use extract, transform, and load (ETL) tools to make it available for analytics. These tools run a fine-toothed comb through data to perform string manipulation, remove outlier values, etc. and produce a data set in the format required by data processing tools.
- Put each type of data into the repository best suited to it––relational, Hadoop, etc.––but run queries between the repositories and return results from one repository to another for post-processing.
The appeal of the first is a large-scale simplicity, in that it uses well-understood systems in parallel. The second brings the familiarity of relational databases for business users to access. This article focuses on the third solution, which has advantages over the others: it avoids the redundancy of the first solution and is much easier to design and maintain than the second. I’ll describe how it is accomplished by Teradata, through its appliances and cloud solutions, but the building blocks are standard, open source tools such as Hive and HCatalog, so this strategy can be implemented by anyone. Read more…


