- Bad Data Guide (Quartz) — An exhaustive reference to problems seen in real-world data along with suggestions on how to resolve them.
- Breakout List — companies where all the action is happening. Read alongside Startup L Jackson’s “How to Get Rich in Tech, Guaranteed.”
- The Economics of Drone Delivery — The analysis is still mostly speculative. Keeney imagines that 6,000 operators who earn $50,000 per year will operate 30,000 to 40,000 drones. Each drone will make 30 deliveries per day. Her analysis ignores depreciation and questions like: ‘How will drones avoid airplanes and deliver packages in Manhattan?’ And there’s another core issue: $12.92 is the price UPS charges to consumers, but its actual marginal cost of delivering one more package along a route they are delivering to already is probably closer to $2. When push comes to shove, will drones be able to compete? (via Chris Anderson)
- 7 Ways Your Data is Telling You It’s a Graph — Network, tree, taxonomy, ancestry, structure – if people are using those words to talk about an organizational chart or reporting structure, they’re telling you that data and the relationships between that data are important.
"graph" entries

Four short links: 25 December 2015
Bad Data, Breakout Startups, Drone Economics, and Graph Signs
Four short links: 12 September 2014
Knowledge Graphs, Multi-Language Declarations, Monitoring, and More Monitoring
- Google Knowledge Vault and Topic Modeling — recap of talks by Google and Facebook staff about how they use their knowledge graphs. I found this super-interesting.
- djinni — A tool for generating cross-language type declarations and interface bindings.
- monit — a small Open Source utility for managing and monitoring Unix systems. Monit conducts automatic maintenance and repair and can execute meaningful causal actions in error situations.
- perf-tooling — List of performance analysis, monitoring and optimization tools.
Four short links: 29 July 2014
Community Detection, Proven Kernel, Graph Processing on GPUs, and Browser Vision
- Online Community Detection for Large Complex Networks (PLosONE) — readable recount of earlier algorithms and inventions in the area, as well as a new algorithm with linear time complexity for large complex networks.
- sel4 — open source OS kernel (GPLv2, most userland is BSD) with end-to-end proof of implementation correctness and security enforcement. (For a discussion of what’s verified, see this blog post)
- mapgraph.io — Massively Parallel Graph processing on GPUs. (via Leo Meyerovich)
- tracking.js — browser framework and algorithms for computer vision algorithms and frameworks.

There are many use cases for graph databases and analytics
Business users are becoming more comfortable with graph analytics.
 The rise of sensors and connected devices will lead to applications that draw from network/graph data management and analytics. As the number of devices surpasses the number of people — Cisco estimates 50 billion connected devices by 2020 — one can imagine applications that depend on data stored in graphs with many more nodes and edges than the ones currently maintained by social media companies.
This means that researchers and companies will need to produce real-time tools and techniques that scale to much larger graphs (measured in terms of nodes & edges). I previously listed tools for tapping into graph data, and I continue to track improvements in accessibility, scalability, and performance. For example, at the just-concluded Spark Summit, it was apparent that GraphX remains a high-priority project within the Spark1 ecosystem.
Network Science dashboards
Networks graphs can be used as primary visual objects with conventional charts used to supply detailed views
With Network Science well on its way to being an established academic discipline, we’re beginning to see tools that leverage it. Applications that draw heavily from this discipline make heavy use of visual representations and come with interfaces aimed at business users. For business analysts used to consuming bar and line charts, network visualizations take some getting used. But with enough practice, and for the right set of problems, they are an effective visualization model.
In many domains, networks graphs can be the primary visual objects with conventional charts used to supply detailed views. I recently got a preview of some dashboards built using Financial Network Analytics (FNA). Read more…
Extending GraphLab to tables
The popular graph analytics framework extends its coverage of the data science workflow
GraphLab’s SFrame, an interesting and somewhat under-the-radar tool was unveiled1 at Strata Santa Clara. It is a disk-based, flat table representation that extends GraphLab to tabular data. With the addition of SFrame, users can leverage GraphLab’s many algorithms on data stored as either graphs or tables. More importantly SFrame increases GraphLab’s coverage of the data science workflow: it allows users with terabyte-sized datasets to clean their data and create new features directly within GraphLab (SFrame performance can scale linearly with the number of available cores).
The beta version of SFrame can read data from local disk, HDFS, S3 or a URL, and save to a human-readable .csv or a more efficient native format. Once an SFrame is created and saved to disk no reprocessing of the data is needed. Below is Python code that illustrates how to read a .csv file into SFrame, create a new data feature and save it to disk on S3:
Big Data solutions through the combination of tools
Applications get easier to build as packaged combinations of open source tools become available
As a user who tends to mix-and-match many different tools, not having to deal with configuring and assembling a suite of tools is a big win. So I’m really liking the recent trend towards more integrated and packaged solutions. A recent example is the relaunch of Cloudera’s Enterprise Data hub, to include Spark1 and Spark Streaming. Users benefit by gaining automatic access to analytic engines that come with Spark2. Besides simplifying things for data scientists and data engineers, easy access to analytic engines is critical for streamlining the creation of big data applications.
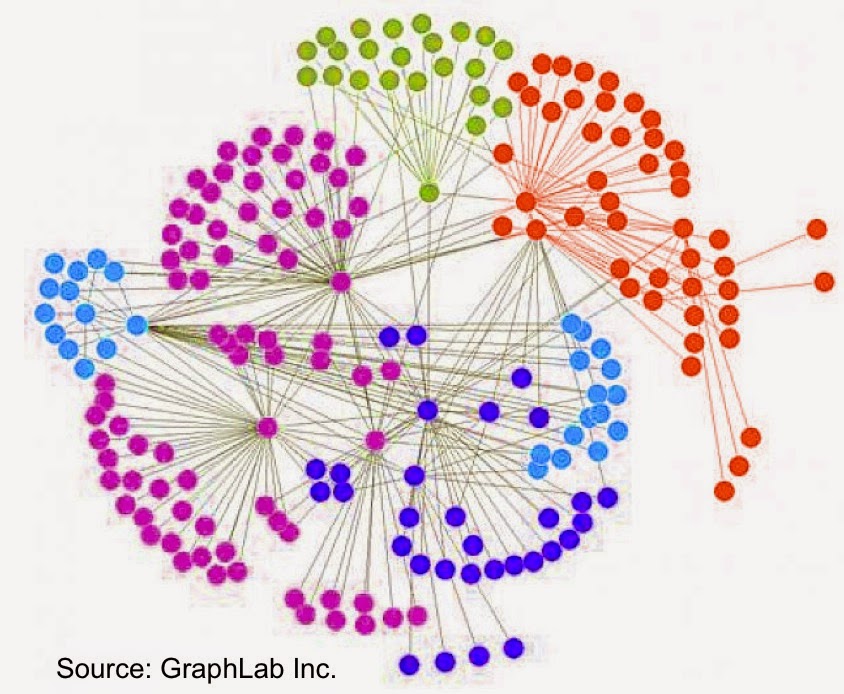
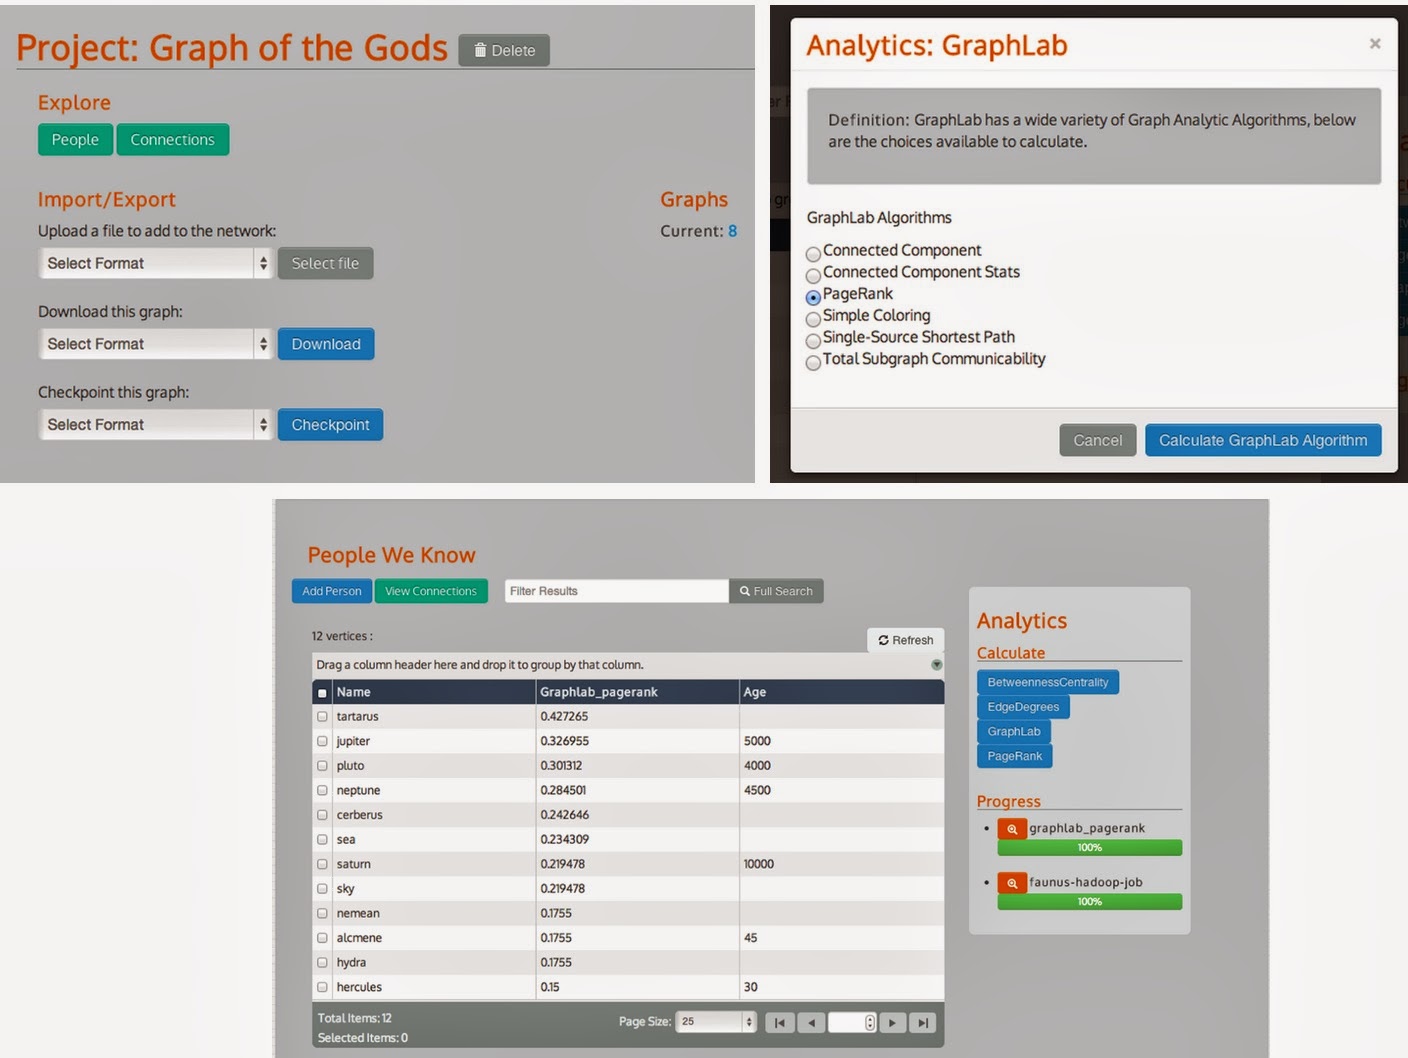
Another recent example is Dendrite3 – an interesting new graph analysis solution from Lab41. It combines Titan (a distributed graph database), GraphLab (for graph analytics), and a front-end that leverages AngularJS, into a Graph exploration and analysis tool for business analysts:
Four short links: 15 January 2014
SCADA Security, Graph Clustering, Facebook Flipbook, and Projections Illustrated
- Hackers Gain ‘Full Control’ of Critical SCADA Systems (IT News) — The vulnerabilities were discovered by Russian researchers who over the last year probed popular and high-end ICS and supervisory control and data acquisition (SCADA) systems used to control everything from home solar panel installations to critical national infrastructure. More on the Botnet of Things.
- mcl — Markov Cluster Algorithm, a fast and scalable unsupervised cluster algorithm for graphs (also known as networks) based on simulation of (stochastic) flow in graphs.
- Facebook to Launch Flipboard-like Reader (Recode) — what I’d actually like to see is Facebook join the open web by producing and consuming RSS/Atom/anything feeds, but that’s a long shot. I fear it’ll either limit you to whatever circle-jerk-of-prosperity paywall-penetrating content-for-advertising-eyeballs trades the Facebook execs have made, or else it’ll be a leech on the scrotum of the open web by consuming RSS without producing it. I’m all out of respect for empire-builders who think you’re a fool if you value the open web. AOL might have died, but its vision of content kings running the network is alive and well in the hands of Facebook and Google. I’ll gladly post about the actual product launch if it is neither partnership eyeball-abuse nor parasitism.
- Map Projections Illustrated with a Face (Flowing Data) — really neat, wish I’d had these when I was getting my head around map projections.
Four short links: 17 December 2013
Graph Compression, Learning Minecraft Coding, Performance Enhancing, and Explained Shell
- WebGraph — a framework for graph compression aimed at studying web graphs. It provides simple ways to manage very large graphs, exploiting modern compression techniques. (via Ben Lorica)
- Learn to Program with Minecraft Plugins — You’ll need to add features to the game itself: learn how to build plugins for your own Minecraft server using the Java programming language. You don’t need to know anything about programming to get started—-this book will teach you everything you need to know! Shameless Christmas stocking bait! (via Greg Borenstein)
- In Search of Perfection, Young Adults Turn to Adderall at Work (Al Jazeera) — “Adderall is just the tip of the iceberg,” Essig said. “There are lots more drugs coming down the pike. The way we set up our cultural model for dealing with psychologically performance-enhancing drugs is a real serious question.”
- Explain Shell — uses parsed manpages to explain a shell commandline. (via Tracy K Teal)
Four short links: 6 December 2013
AI Book, Science Superstars, Engineering Ethics, and Crowdsourced Science
- Society of Mind — Marvin Minsky’s book now Creative-Commons licensed.
- Collaboration, Stars, and the Changing Organization of Science: Evidence from Evolutionary Biology — The concentration of research output is declining at the department level but increasing at the individual level. […] We speculate that this may be due to changing patterns of collaboration, perhaps caused by the rising burden of knowledge and the falling cost of communication, both of which increase the returns to collaboration. Indeed, we report evidence that the propensity to collaborate is rising over time. (via Sciblogs)
- As Engineers, We Must Consider the Ethical Implications of our Work (The Guardian) — applies to coders and designers as well.
- Eyewire — a game to crowdsource the mapping of 3D structure of neurons.