"Julia" entries

IPython: A unified environment for interactive data analysis
It has roots in academic scientific computing, but has features that appeal to many data scientists
As I noted in a recent post on reproducing data projects, notebooks have become popular tools for maintaining, sharing, and replicating long data science workflows. Much of that is due to the popularity of IPython1. In development since 2001, IPython grew out of the scientific computing community and has slowly added features that appeal to data scientists.
Roots in academic scientific computing
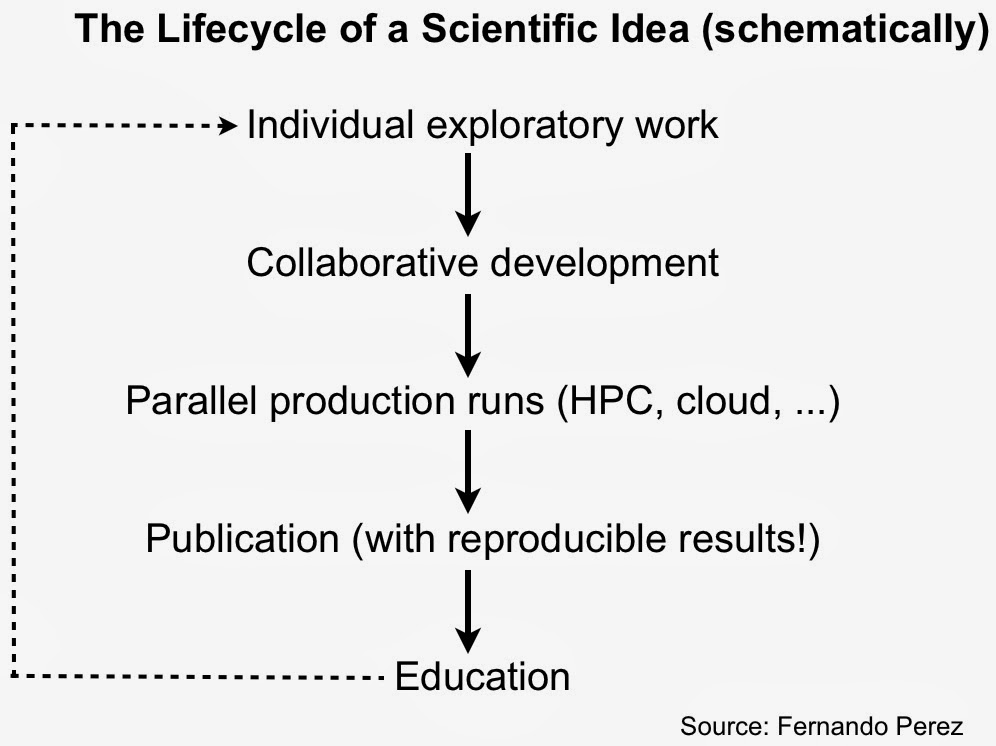
As IPython creator Fernando Perez noted in his “historical retrospective”, exploratory analysis in a scientific setting requires a solid interactive environment. After years of development IPython has become a great tool for interacting with data. IPython also addresses other important pain points for scientists – reproducibility and collaboration – issues that are equally important to data scientists working in industry.
IPython is more than just Python
With an interactive widget architecture that’s 100% language-agnostic, these days IPython is used by many other programming language communities2, including Julia, Haskell, F#, Ruby, Go, and Scala. If you’re a data scientist who likes to mix-and-match languages, you can create, maintain, and share multi-language data projects in IPython:

Julia’s Role in Data Science
Myths and Realities
Introduction
Since its first public release in February 2012, the Julia programming language has received a lot of hype. This has led to some confusion about the language’s current status. In this post, I’d like to make clear where Julia stands and where Julia is going, especially in regard to Julia’s role in data science, where the dominant languages are R and Python. We’re working hard to make Julia a viable alternative to those languages, but it’s important to separate out myth from reality.
Where Julia Stands
In order to the dispel some of the confusion about Julia, I want to discuss the two main types of misunderstandings that I come across:
- Confusion 1: Julia already possesses a mature package ecosystem and can be used as a feature-complete replacement for R or Python.
- Confusion 2: Julia’s compiler is so good that it will make any piece of code fast – even bad code.
Data analysis tools target non-experts
Tools simplify the application of advanced analytics and the interpretation of results
A new set of tools make it easier to do a variety of data analysis tasks. Some require no programming, while other tools make it easier to combine code, visuals, and text in the same workflow. They enable users who aren’t statisticians or data geeks, to do data analysis. While most of the focus is on enabling the application of analytics to data sets, some tools also help users with the often tricky task of interpreting results. In the process users are able to discern patterns and evaluate the value of data sources by themselves, and only call upon expert1 data analysts when faced with non-routine problems.
Visual Analysis and Simple Statistics
Three SaaS startups – DataHero, DataCracker, Statwing – make it easy to perform simple data wrangling, visual analysis, and statistical analysis. All three (particularly DataCracker) appeal to users who analyze consumer surveys. Statwing and DataHero simplify the creation of Pivot Tables2 and suggest3 charts that work well with your data. StatWing users are also able to execute and view the results of a few standard statistical tests in plain English (detailed statistical outputs are also available).
Statistics and Machine-learning
BigML and Datameer’s Smart Analytics are examples of recent tools that make it easy for business users to apply machine-learning algorithms to data sets (massive data sets, in the case of Datameer). It makes sense to offload routine data analysis tasks to business analysts and I expect other vendors such as Platfora and ClearStory to provide similar capabilities in the near future.

MATLAB, R, and Julia: Languages for data analysis
Inside core features of specialized data analysis languages.
Big data frameworks like Hadoop have received a lot of attention recently, and with good reason: when you have terabytes of data to work with — and these days, who doesn’t? — it’s amazing to have affordable, reliable and ubiquitous tools that allow you to spread a computation over tens or hundreds of CPUs on commodity hardware. The dirty truth is, though, that many analysts and scientists spend as much time or more working with mere megabytes or gigabytes of data: a small sample pulled from a larger set, or the aggregated results of a Hadoop job, or just a dataset that isn’t all that big (like, say, all of Wikipedia, which can be squeezed into a few gigs without too much trouble).
At this scale, you don’t need a fancy distributed framework. You can just load the data into memory and explore it interactively in your favorite scripting language. Or, maybe, a different scripting language: data analysis is one of the few domains where special-purpose languages are very commonly used. Although in many respects these are similar to other dynamic languages like Ruby or Javascript, these languages have syntax and built-in data structures that make common data analysis tasks both faster and more concise. This article will briefly cover some of these core features for two languages that have been popular for decades — MATLAB and R — and another, Julia, that was just announced this year.
MATLAB
MATLAB is one of the oldest programming languages designed specifically for data analysis, and it is still extremely popular today. MATLAB was conceived in the late ’70s as a simple scripting language wrapped around the FORTRAN libraries LINPACK and EISPACK, which at the time were the best way to efficiently work with large matrices of data — as they arguably still are, through their successor LAPACK. These libraries, and thus MATLAB, were solely concerned with one data type: the matrix, a two-dimensional array of numbers.
This may seem very limiting, but in fact, a very wide range of scientific and data-analysis problems can be represented as matrix problems, and often very efficiently. Image processing, for example, is an obvious fit for the 2D data structure; less obvious, perhaps, is that a directed graph (like Twitter’s follow graph, or the graph of all links on the web) can be expressed as an adjacency matrix, and that graph algorithms like Google’s PageRank can be easily implemented as a series of additions and multiplications of these matrices. Similarly, the winning entry to the Netflix Prize recommendation challenge relied, in part, on a matrix representation of everyone’s movie ratings (you can imagine every row representing a Netflix user, every column a movie, and every entry in the matrix a rating), and in particular on an operation called Singular Value Decomposition, one of those original LINPACK matrix routines that MATLAB was designed to make easy to use.