"machine data" entries

A growing number of applications are being built with Spark
Many more companies want to highlight how they're using Apache Spark in production.
One of the trends we’re following closely at Strata is the emergence of vertical applications. As components for creating large-scale data infrastructures enter their early stages of maturation, companies are focusing on solving data problems in specific industries rather than building tools from scratch. Virtually all of these components are open source and have contributors across many companies. Organizations are also sharing best practices for building big data applications, through blog posts, white papers, and presentations at conferences like Strata.
These trends are particularly apparent in a set of technologies that originated from UC Berkeley’s AMPLab: the number of companies that are using (or plan to use) Spark in production1 has exploded over the last year. The surge in popularity of the Apache Spark ecosystem stems from the maturation of its individual open source components and the growing community of users. The tight integration of high-performance tools that address different problems and workloads, coupled with a simple programming interface (in Python, Java, Scala), make Spark one of the most popular projects in big data. The charts below show the amount of active development in Spark:

For the second year in a row, I’ve had the privilege of serving on the program committee for the Spark Summit. I’d like to highlight a few areas where Apache Spark is making inroads. I’ll focus on proposals2 from companies building applications on top of Spark.

Machine Data at Strata: “BigData++”
By David Andrzejewski of SumoLogic

Photo Courtesy of David Andrzejewski
A few weeks ago I had the pleasure of hosting the machine data track of talks at Strata Santa Clara. Like “big data”, the phrase “machine data” is associated with multiple (sometimes conflicting) definitions, two prominent ones come from Curt Monash and Daniel Abadi. The focus of the machine data track is on data which is generated and/or collected automatically by machines. This includes software logs and sensor measurements from systems as varied as mobile phones, airplane engines, and data centers. The concept is closely related to the “internet of things”, which refers to the trend of increasing connectivity and instrumentation in existing devices, like home thermostats.
More data, more problems
This data can be useful for the early detection of operational problems or the discovery of opportunities for improved efficiency. However, the decoupling of data generation and collection from human action means that the volume of machine data can grow at machine scales (i.e., Moore’s Law), an issue raised by both Monash and Abadi. This explosive growth rate amplifies existing challenges associated with “big data”. In particular two common motifs among the talks at Strata were the difficulties around:
- mechanics: the technical details of data collection, storage, and analysis
- semantics: extracting understandable and actionable information from the data deluge
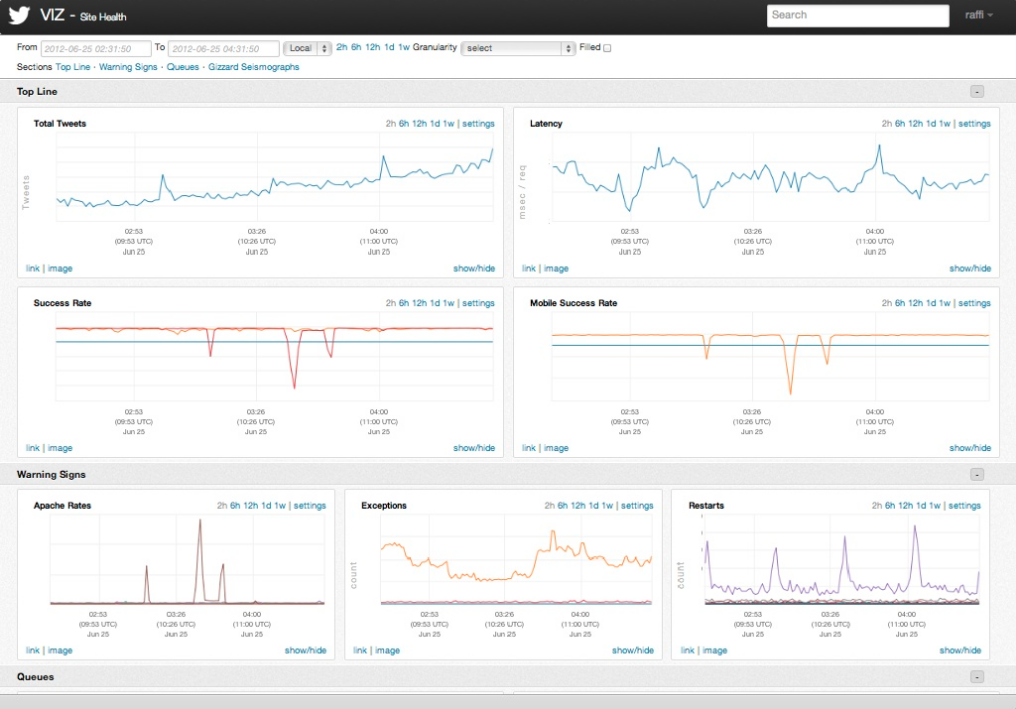
How Twitter monitors millions of time-series
A distributed, near real-time system simplifies the collection, storage, and mining of massive amounts of event data
One of the keys to Twitter’s ability to process 500 millions tweets daily is a software development process that values monitoring and measurement. A recent post from the company’s Observability team detailed the software stack for monitoring the performance characteristics of software services, and alert teams when problems occur. The Observability stack collects 170 million individual metrics (time-series) every minute and serves up 200 million queries per day. Simple query tools are used to populate charts and dashboards (a typical user monitors about 47 charts).
The stack is about three years old1 and consists of instrumentation2 (data collection primarily via Finagle), storage (Apache Cassandra), a query language and execution engine3, visualization4, and basic analytics. Four distinct Cassandra clusters are used to serve different requirements (real-time, historical, aggregate, index). A lot of engineering work went into making these tools as simple to use as possible. The end result is that these different pieces provide a flexible and interactive framework for developers: insert a few lines of (instrumentation) code and start viewing charts within minutes5.