- The Remixing Dilemma — summary of research on remixed projects, finding that (1) Projects with moderate amounts of code are remixed more often than either very simple or very complex projects. (2) Projects by more prominent creators are more generative. (3) Remixes are more likely to attract remixers than de novo projects.
- Scratch 2.0 — my favourite first programming language for kids and adults, now in the browser! Downloadable version for offline use coming soon. See the overview for what’s new.
- State Dept Takedown on 3D-Printed Gun (Forbes) — The government says it wants to review the files for compliance with arms export control laws known as the International Traffic in Arms Regulations, or ITAR. By uploading the weapons files to the Internet and allowing them to be downloaded abroad, the letter implies Wilson’s high-tech gun group may have violated those export controls.
- Data Science of the Facebook World (Stephen Wolfram) — More than a million people have now used our Wolfram|Alpha Personal Analytics for Facebook. And as part of our latest update, in addition to collecting some anonymized statistics, we launched a Data Donor program that allows people to contribute detailed data to us for research purposes. A few weeks ago we decided to start analyzing all this data… (via Phil Earnhardt)
"social graph" entries

Four short links: 10 May 2013
Remixing Success, Scratch in the Browser, 3D Takedown, and Wolfram Network Analysis

Why isn’t social media more like real life?
You know the graph. Use it to provide a more human experience.
I finally got around to looking at my personal network graph on Linkedin Labs the other day. It was a fun exercise and I got at least one interesting insight from it.
Take a look at these two well defined and distinct clusters in my graph. These are my connections with the startup I worked for (blue) and the company that acquired us in 2008 (orange). It is fascinating to me that all these years later the clusters remain so disconnected. There are shared connections within a common customer base, but very few direct connections across the clusters. I would love to see maps from some of my other colleagues who are still there to see if theirs show the same degree of separation. This was an acquisition that never really seemed to click and whether this is a picture of cause or effect, it maps to my experiences living in it.
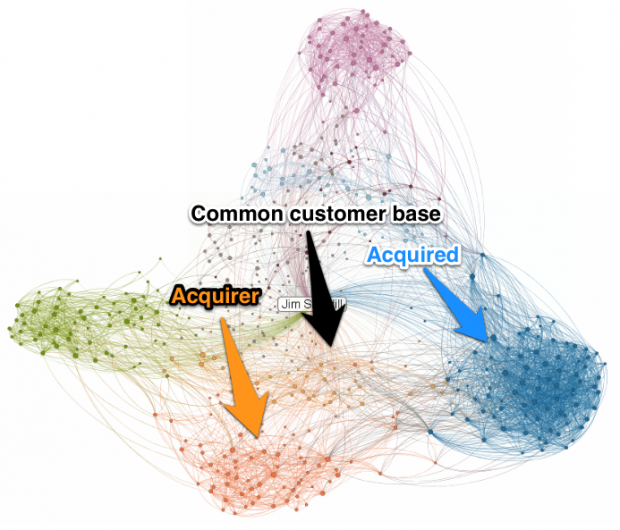
That’s an aside though. What this graph really puts in stark relief is what every social network out there is learning about us. And this graph doesn’t really tell the whole story because it doesn’t represent edge weights and types, which they also know. Social networks know who we connect with, who we interact with, and the form and strength of those interactions.
But this post isn’t a privacy rant. I know they know this stuff and so do you. What this image got me thinking about again is why social networks aren’t using this information to create for us a social experience that is more like our real world, and frankly more in tune with our human-ness. Read more…

GraphChi: Graph analytics over billions of edges using your laptop
A disk-based, single-node, graph analytics system that scales to massive graphs
GraphChi is a spinoff project of GraphLab, an open source, distributed, in-memory software system for analytics and machine-learning.

Designed specifically to run on a single computer with limited memory1 (DRAM), since its release a few months ago GraphChi has been used to analyze graphs with billions of edges. Running on a single machine means deployment and debugging are simpler. In addition it is no longer necessary to find (optimal) graph partitions that minimize communication between compute nodes – the starting point for many distributed graph computations.
The stated goal of GraphChi is to “Compute on graphs with billions of edges, in a reasonable time, on a single PC.” One way to define “reasonable amount of computation time” is to compare against the results produced by other graph processing systems. That’s exactly what GraphChi’s creators did in a recent paper. They found that GraphChi compared favorably to graph analytics packages such as Pegasus and Stanford GPS. While GraphChi was 2-3X slower2 in some cases, it is easier to deploy, easier to debug, and way more energy efficient. Read more…
Four short links: 23 August 2012
Computational Social Science, Infrastructure Drives Design, Narcodrones Imminent, and Muscle Memory
- Computational Social Science (Nature) — Facebook and Twitter data drives social science analysis. (via Vaughan Bell)
- The Single Most Important Object in the Global Economy (Slate) — Companies like Ikea have literally designed products around pallets: Its “Bang” mug, notes Colin White in his book Strategic Management, has had three redesigns, each done not for aesthetics but to ensure that more mugs would fit on a pallet (not to mention in a customer’s cupboard). (via Boing Boing)
- Narco Ultralights (Wired) — it’s just a matter of time until there are no humans on the ultralights. Remote-controlled narcodrones can’t be far away.
- Shortcut Foo — a typing tutor for editors, photoshop, and the commandline, to build muscle memory of frequently-used keystrokes. Brilliant! (via Irene Ros)
Four short links: 16 August 2012
Terms of Service, Exporting Copyright, Monitoring Networks, and Learning Programming
- The Medium Terms of Service — easily the best terms of service I’ve ever read. Clear and English wherever possible, apologetically lawyered-up CAPITALS where necessary. Buy that lawyer a beer.
- All Nations Lose Under TPP’s Expansion of Copyright Terms (EFF) — leaks reveal the USA negotiators’ predictable attempt to expand the term of copyright in other nations. TPP is a multinational SOPA.
- Network Theory to Identify Origins of Outbreaks (MIT Technology Review) — “By monitoring only 20% of the communities, we achieve an average error of less than 4 hops between the estimated source and the first infected community”. The paper says it depends on good knowledge of the network, which makes me wonder how useful it will be for government tracing of Anons and the like.
- Introducing Khan CS — John Resig built a Bret Victor-inspired teaching environment for learning Javascript. Nicely done, and soon to be open source.
Four short links: 27 July 2012
Weibo cf Twitter, Rendering Fonts, Clothing Manufacturing, and Profiling Python
- Social Media in China (Fast Company) — fascinating interview with Tricia Wang. We often don’t think we have a lot to learn from tech companies outside of the U.S., but Twitter should look to Weibo for inspiration for what can be done. It’s like a mashup of Tumblr, Zynga, Facebook, and Twitter. It’s very picture-based, whereas Twitter is still very text-based. In Weibo, the pictures are right under each post, so you don’t have to make an extra click to view them. And people are using this in subversive ways. Whether you’re using algorithms to search text or actual people–and China has the largest cyber police force in the world—it’s much easier to censor text than images. So people are very subversive in hiding messages in pictures. These pictures are sometimes very different than what people are texting, or will often say a lot more than the actual text itself. (via Tricia Wang)
- A Treatise on Font Rasterisation With an Emphasis on Free Software (Freddie Witherden) — far more than you ever thought you wanted to know about how fonts are rendered. (via Thomas Fuchs)
- Softwear Automation — robots to make clothes, something which is surprisingly rare. (via Andrew McAfee)
- A Guide to Analyzing Python Performance — finding speed and memory problems in your Python code. With pretty pictures! (via Ian Kallen)

Visualization of the Week: Clustering your social graph
A Facebook app organizes your friends via shared interests and experiences.
This week's visualization clusters your Facebook friends based on shared education, location, occupation, and interests.
Four short links: 9 March 2012
Real World User Experience, Biovis your Social Network, Analytics for Phone Sales, and Classy OpenStreetMap
- Why The Symphony Needs A Progress Bar (Elaine Wherry) — an excellent interaction designer tackles the real world.
- Biologic — view your social network as though looking at cells through a microscope. Gorgeous and different.
- The Cost of Cracking — analysis of used phone listings to see what improves and decreases price yields some really interesting results. Phones described as “decent” are typically priced 23% below the median. Who would describe something they’re selling as “decent” and price it below market value unless something fishy was going on? […] On average, cracking your phone destroys 30-50% of its value instantly. Particularly interesting to me since Ms 10 just brought home her phone with *cough* a new starburst screensaver.
- OpenStreetMap Welcomes Apple — this is the classy way to deal with the world’s richest company quietly and badly using your work without acknowledgement.
Four short links: 7 February 2012
Version Control, Data Tables, Developer Communities, and Reality Mining
- Integrated Content Editor (GitHub) — a track changes implementation, built in javascript, for anything that is contenteditable on the web, written by the NY Times team and open sourced.
- Data Tables — featureful jQuery plugin for tables of data. (via Javascript Weekly)
- Creating a Developer Community (Slideshare) — treat the problem like a channel conversion funnel: turn visitors into downloaders, downloaders into users, users into contributors. His screenshots of shitty conversions are great! (via Kohsuke Kawaguchi)
- Sex Differences in Intimate Relationships (PDF) — Albert-Laszlo Barabasi and others use social graph analysis to analyze communications patterns in relationships. Notice that not only does the preference for an opposite-sex “best friend” kick in significantly earlier for females than for males (~18 years vs mid-20s, respectively), but females maintain a higher plateau value for much longer. More reality mining to understand ourselves. (via Sean Gourley)
Four short links: 6 February 2012
E-Commerce Analytics, Text Mining on Hadoop, Bozonics, and It's Safe To Write With a Mac Again
- Jirafe — open source e-commerce analytics for Magento platform.
- iModela — a $1000 3D milling machine. (via BoingBoing)
- It’s Too Late to Save The Common Web (Robert Scoble) — paraphrased: “Four years ago, I told you all that Google and Facebook were evil. You did nothing, which is why I must now use Google and Facebook.” His list of reasons that Facebook beats the Open Web gives new shallows to the phrase “vanity metrics”. Yes, the open web does not go out of its way to give you an inflated sense of popularity and importance. On the other hand, the things you do put there are in your control and will stay as long as you want them to. But that’s obviously not a killer feature compared to a bottle of Astroglide and an autorefreshing page showing your Klout score and the number of Google+ circles you’re in.
- iBooks Author EULA Clarified (MacObserver) — important to note that it doesn’t say you can’t use the content you’ve written, only that you can’t sell .ibook files through anyone but Apple. Less obnoxious than the “we own all your stuff, dude” interpretation, but still a bit crap. I wonder how anticompetitive this will be seen as. Apple’s vertical integration is ripe for Justice Department investigation.