"strata session sc 2013" entries

Why? Why? Why!
A lesson for data science teams.
By Dean Malmgren and Mike Stringer
The other day we had a conversation with a bespectacled senior data scientist at another organization (named X to protect the innocent). The conversation went something like this:
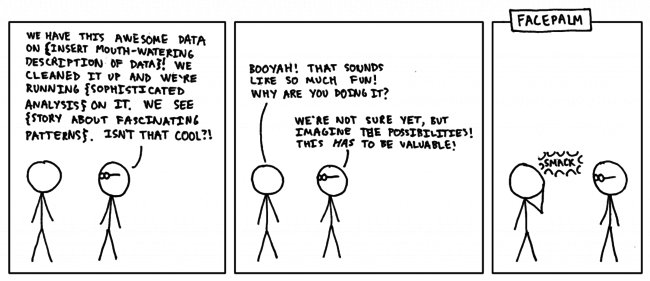
Many of us have had similar conversations with people like X, and many of us have even been X before. Data scientists, being curious individuals, enjoy working on problems for the sake of doing something interesting, fun, technically challenging, or because their boss heard about “big data” in the Wall Street Journal. These reasons are all distinctly different from trying to solve an important problem.
Large-Scale Data Collection and Real-Time Analytics Using Redis
Insights from a Strata Santa Clara 2013 session
Strata Santa Clara 2013 is a wrap, and I had a great time speaking and interacting with all of the amazing attendees. I’d like to recap the talk that Tim Palko and I gave, entitled “Large-Scale Data Collection and Real-Time Analytics Using Redis”, and maybe even answer a few questions we were asked following our time on stage.
Our talk centered around a system we designed to collect environmental sensor data from remote sensors located in various places across the country and provide real-time visualization, monitoring, and event detection. Our primary challenge for the initial phase of development proved to be scaling the system to collect data from thousands of nodes, each of which sent sensor readings roughly once per second, which maintaining the ability to query the data in real time for event detection. While each data record was only ~300kb, our expected maximum sensor load indicated a collection rate of about 27 million records, or 8GB, per hour. However, our primary issue was not data size, but data rate. A large number of inserts had to happen each second, and we were unable to buffer inserts into batches or transactions without incurring a delay in the real-time data stream.
Tips and Tricks for Debugging Distributed Systems
Preview of upcoming session at the Strata Conference
I’m talking on Wednesday at Strata about Tips and Tricks for Debugging Distributed Systems. You should come check it out.
As a preview, let’s talk about two pretty pictures.
Network Visualization

I’m running some typical distributed systems (HDFS, MapReduce, Impala, HBase, Zookeeper) on a small, seven-node cluster. The diagram above has individual processes and the TCP connections they’ve established to each other. Some processes are “masters” and they end up talking to many other processes.
Sketching techniques for real-time big data
Preview of an upcoming session at Strata Santa Clara

Bahman Bahmani
In many modern web and big data applications the data arrives in a streaming fashion and needs to be processed on the fly. In these applications, the data is usually too large to fit in main memory, and the computations need to be done incrementally upon arrival of new pieces of data. Sketching techniques allow these applications to be realized with high levels of efficiency in memory, computation, and network communications.
In the algorithms research community, sketching techniques first appeared in the literature in 1980s, e.g., in the seminal work of Philippe Flajolet and G. Nigel Martin, then caught attentions in late 1990s, partially inspired by the award-winning work of Noga Alon, Yossi Matias, and Mario Szegedy, and were/are on fire in 2000’s/2010’s, when sketches got successfully designed not only for fundamental problems such as heavy hitters, but also for matrix computations, network algorithms, and machine learning. These techniques are now at an inflection point in the course of their history, due to the following factors:
1. Untapped potential: Being so new, their huge practical potential has been yet barely tapped into.
2. Breadth and maturity: They are now both broad and mature enough to start to be widely used across a variety of big data applications, and even act as basic building blocks for new highly efficient big data management systems.
Who do you trust? You are surrounded by bots.
Preview of upcoming session "Who is Fake?" at the Strata Conference
By Lutz Finger
In the Matrix, the idea of a computer algorithm determining what we think may seemed far-fetched. Really? Far-fetched? Let’s look at some numbers.
About half of all Americans get their news in digital form. This news is written up by journalists, half of whom at least partially source their stories from social media. They use tools to harvest the real time knowledge of 100,000 tweets per second and more.
But what if someone could influence those tools and create messages that look as though they were part of a common consensus? Or create the appearance of trending?
Keep your data science efforts from derailing
Preview of upcoming session at Strata Santa Clara
By Marck Vaisman and Sean Murphy
Is your organization considering embracing data science? If so, we would like to give you some helpful advice on organizational and technical issues to consider before you embark on any initiatives or consider hiring data scientists. Join us, Sean Murphy and Marck Vaisman, two Washington, D.C. based data scientists and founding members of Data Community DC, as we walk you through the trials and tribulations of practicing data scientists at our upcoming talk at Strata.
We will discuss anecdotes and best practices, and finish by presenting the results of a survey we conducted last year to help understand the varieties of people, skills, and experiences that fall under the broad term of “Data Scientist”. We analyzed data from over 250 survey respondents, and are excited to share our findings, which will also be published soon by O’Reilly.

Maps not lists: network graphs for data exploration
Preview of upcoming Strata session on data exploration
Amy Heineike is Director of Mathematics for Quid Inc, where she has been since its inception, prototyping and launching the company’s technology for analyzing document sets. Below is the teaser for her upcoming talk at Strata Santa Clara.
I recently discovered that my favorite map is online. It used to hang on my housemate’s wall in our little house in London back in 2005. At the time I was working to understand how London was evolving and changing, and how different policy or infrastructure changes (a new tube line, land use policy changes) would impact that.
The map was originally published as a center-page pull out from the Guardian, showing the ethnic groups that dominate different neighborhoods across the city. The legend was as long as the image, and the small print labels necessitated standing up close, peering and reading, tracing your finger to discover the Congolese on the West Green Road, our neighbors the Portuguese on the Stockwell Road, or the Tamils in Chessington in the distant south west.

Fruit or mobile device: learning concepts through connections
Preview of insights shared at upcoming session at Strata Santa Clara
Social media gives us the power to share content and engage with a wide range of internet users. As a person or brand, we are often concerned with who we are talking to and how we can better serve our viewers. Traditional demographics such as ‘female’ and ‘25-30’ are no longer sufficient in this arena. For example, Google is having a hard time getting gender and age correct for ad preferences. It is more interesting to observe what content is consumed and how attention changes over time.
Bitly, which is used to shorten and share links, can offer insight into this space. This means the data has an unprecedented view into what people are sharing and has a holistic view of what users are concerned about on the internet.
We use their data to look into how we can define the audience of different content. The simplest example of this is: given a group of users that click on “oreilly.com”, what other websites do they engage with. We now have what bitly calls a co-click graph. Domains are represented as nodes while edges between nodes represent the number of people that have clicked on each domain. A co-click graph can be made to represent any number of attributes, but for now we are going to remain interested in topics and keywords.


That’s it — I’m taking my data and going home
We are simply not good at playing with others when it comes to data
Russia’s railway gauge is different from Western Europe’s. At the border of the former Soviet states, the Russian gauge of 1.524m meets the European & American ‘Standard’ gauge of 1.435m. The reasons for this literal disconnect arise from discussions between the Tsar and his War Minister. When asked the most effective way to prevent Russia’s own rail lines being used against them in times of invasion, the Minister suggested a different gauge to prevent supply trains rolling through the border. The artifact of this decision remains visible today at all rail crossings between Poland and Belarus or Slovakia and Ukraine. The rail cars are jacked up at the border, new wheels inserted underneath, and the car lowered again. It is about a 2-4 hour time burn for each crossing.
Per head, per crossing, over 170 years, is a heck of a lot of resource wasted. But to change it would entail changing the rail stock of the entire country and realigning about 225,000 km (140,000 mi) of track.
Talk about technical debt.
Data suffers from a similar disconnect. It really wasn’t until the advent of XML 15 years ago that we had an agreed (but not entirely satisfactory) mechanism for storing arbitrary data structures outside the application layer. This is as much a commentary on our technical priorities as it is a social indictment. We are simply not good at playing with others when it comes to data.
BigData Top 100 Initiative
A Call for Industry-Standard Benchmarks for Big Data Platforms at Strata SC 2013
By Milind Bhandarka, Chaitan Baru, Raghunath Nambiar, Meikel Poess, and Dr. Tilmann Rabl
Big data systems are characterized by their flexibility in processing diverse data genres, such as transaction logs, connection graphs, and natural language text, with algorithms characterized by multiple communication patterns, e.g. scatter-gather, broadcast, multicast, pipelines, and bulk-synchronous. A single benchmark that characterizes a single workload could not be representative of such a multitude of use-cases. However, our systematic study of several use-cases of current big data platforms indicates that most workloads are composed of a common set of stages, which capture the variety of data genres and algorithms commonly used to implement most data-intensive end-to-end workloads. Our upcoming session at Strata SC discusses the BigData Top 100 List, a new community-based initiative for benchmarking big data systems.