
Book Sales as a Technology Trend Indicator
Based on data from Nielsen Bookscan, which aggregates point-of-sale data from about 70% of US bookstores, including Amazon, Barnes & Noble, Borders, and many smaller chains and leading independent bookstores, computer book sales, which have been falling by about 20% a year since 2001, have stabilized, and started to climb again. O'Reilly's internal market research group has built a MySQL data mart containing the Bookscan data since early 2003, and uses it for visualization and trend analysis. In this posting, I draw a few conclusions based on a year-on-year comparison of 2004 and 2005. Apart from giving us some interesting technology trend indicators (C# is gaining on Java, python is gaining on perl, InDesign is eating Quark's lunch), the data may also give us some intriguing insight into other economic factors. For example, might the increase in sales of books on QuickBooks and Excel indicate a rise in small business activity?
In an attempt to make the Bookscan data more useful for our editors and our resellers, O'Reilly Research has been loading the weekly top 3000 Computer Books into a MySQL-based data mart. We've supplemented the raw Bookscan data with additional information spidered from Amazon, such as the retail price, the number and rating of Amazon reviews, page count, and publication date.
What's more, we've grouped the books into related technology categories, user level, publisher, series, and other "data dimensions", allowing us to report not just on individual titles but on the performance of broad industry segments. We've added to the database a rich set of data visualization, graphing and reporting tools.
2003-2005 Year-on-Year Comparison
The graph below shows the overall market trend since 2003. You can see the marked seasonality, with each of the years showing a consistent trend. Many of the same peaks and valleys occur week by week throughout the year. Even though 2004 sales were about 20% below 2003, in terms of weekly detail, the graphs of the two years are close to mirror images � despite the release of thousands of new books and dozens of new software versions during the period we've studied. (The yearly decline was the continuation of a three year trend. 2003 was about 20% below 2002, which in turn was down about 20% from 2001 -- it's been a tough couple of years for the computer book market and the industry as a whole.)
But what's really interesting to us is that the market appears to have hit bottom, with the 2005 graph overlaid neatly on 2004. In fact, 2005 was ahead of 2004 in seven of the thirteen weeks graphed here. This is really good news for our business, and perhaps for the whole computer industry, as the sales rate of computer books is likely a good indicator of an overall increase in industry activity.
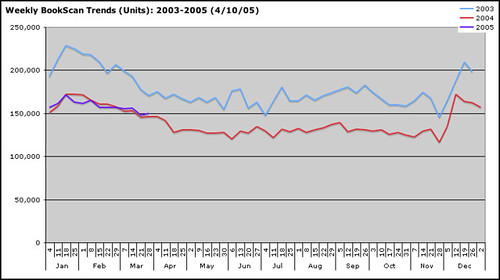
What's especially encouraging about this graph is that several major software products, including Mac OS X, Photoshop CS, Flash MX 2004, and Dreamweaver MX 2004, had been released late in 2003, and book sales on these new products was just peaking in the first quarter of 2004. By contrast, sales of books on these products are all depressed in the first quarter of 2005 as users await upcoming software releases later this year.
Note: We show 53 weeks in 2004�because of the dates on which weeks ended, the 2003 graph ends on December 26, the 2004 graph on January 2. The ISO standard for matching up weekly data across two years uses the convention that if the last day of the year is on a Thursday or on a Thursday or Friday of a leap year, then the year contains 53 weeks. However, we believe that you get a better sense of the 2004/2005 seasonality if you match up starting with January 3 of 2004, and January 5 of 2005. Therefore, the data from the end of 2004 (week 53) is duplicated as week 1 of 2005.
Categorizing the Data
In trying to understand how to organize the more than 8,000 titles in our database, we began with a bottom-up approach. We identified categories by looking for words that are repeated across many titles � for example, the presence of the word Java in a title suggests that the book belongs in a Java category. But that's not sufficient � consider one of the hottest selling programming topics of the past year: Jakarta Struts. Enough Struts titles appeared for it to merit a category of its own, yet it also needed to be part of a larger Java category. To give us maximum flexibility, we identified the lowest level categories that were meaningful (a total of 529 of them so far), then rolled them up into larger categories. There are a total of five levels in the category hierarchy. Alternate rollups make it easy to provide specialized views of the same data, to match different editorial programs or retail shelving categories.
The category structure can be viewed as a tree (or a root system, depending which way you draw it). We use a special kind of tool called a Treemap, which flattens a tree structure into two dimensions, for visualizing the entire data structure. This is a tool that was originally developed for visualizing the performance of the various industry sectors that make up the stock market, but it also works very well for our Bookscan analysis.
The image below shows the Treemap view of the Bookscan data warehouse, visualized at the third level of the category hierarchy. It looks a bit like farmland from the air, but is full of meaning once you learn to read it. The size of a block represents the number of units sold in that category during the chosen reporting period. The color represents the change since the previous period � green is up, red is down, and black is unchanged. The brightness of the color represents the amount of the change. This particular treemap shows the change in unit sales by category between Q1 2004 and Q1 2005. (We can show sequential or YoY weeks, months, or quarters, and can also compare publishers, and broader technology dimensions such as operating system, programming language, or database, which cut across multiple technology book categories.)
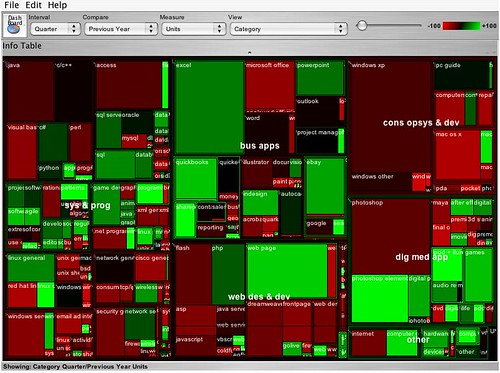
While some of these weekly movements may be anomalous, driven by sales of a single hot new book, or (especially in some of the smaller categories) just by random perturbations in the ordering pattern of large accounts, we believe that especially over longer time periods, they give some indications of deeper trends about what's hot and what's not.
Photoshop Elements was the #1 gainer in terms of absolute difference in the number of units sold, and also showed a strong percentage gain of 77%. This is no surprise: digital cameras were a holiday hit, and this was a new version of a good product at a lower price point. And of course, as the #2 gainer, the iPod category (up 216%) is no surprise. The iPod has been the product of the year, and also experienced a huge holiday sales bump. #8 gainer Sharepoint (up 1857%) was nearly non-existent as a category in 2004. Filemaker (up 109%) was also the beneficiary of a new software release.
On the negative side, several of the big decliners were directly related toa recent new software release in the 2004 numbers: Mac OS X, down 39%, Photoshop CS, down 6.5%, Dreamweaver, down 16%, and Flash, down 14%. All of these categories are expected to rebound significantly later this year along with new releases of those software products.
But there were a number of categories that showed a surge (or decline) without any new software release to drive sales: books on web development (HTML, CSS, and other general books on creating web pages, up 39%), Excel (up 19%), and Quickbooks (up 63%) all showed substantial gains. These are core categories for business, perhaps indicating some kind of rise in small business creation. Powerpoint (up 16%) was also a gainer in the business applications category.
Another interesting market share story is the relative position of Quark and InDesign. InDesign is clearly winning the horse race, with sales up 37%, while Quark book sales declined 35%.
The #5 growth category, Computers and Society (up 129%), is something of a grab-bag, including books on "geek culture" like Revolution in the Valley, The Cult of Mac, and Hackers and Painters, as well as issues-oriented books like The Future of Ideas and We The Media. These books may have benefited from a holiday surge, but it's also worth noting that there seems to be an increasing appetite for these "softer" titles.
On the more technical end of things, we found the increase in database programming titles to be significant. The growth in the SQL category (up 36%) is partly driven by the success of O'Reilly's SQL Pocket Guide, but we believe there is more to the increase than that. Database literacy is becoming an increasingly essential part of the IT skill set. SQL Server (up 8%) is also showing growth, while sales of books on Oracle are down 6%. Sales of books on MySQL are also down slightly, by 2%.
Also notable is the growth in software engineering titles. The category as a whole was up 25% versus January 2004, led by categories such as Object oriented development, up 245%, and Patterns, up 55%. While individual titles such as the recently introduced bestseller Head First Design Patterns may have an impact, we also believe that the growth in this area may be the result of developers looking to upgrade their skills in a tough job market.
In terms of computer languages, PHP (up 16%) continues its strong growth. C# (up 2.5% over last year) was the only other programming language whose growth was in positive territory. By contrast, sales of books on Java (down 10%), Visual Basic (down 23%), C/C++ (down 4%), Perl (down 14%), Python (down 9%), and Javascript (down 12%) were all lower than they were in the same period a year ago.
Even though both are declining, the comparison of Perl and Python sales figures is especially interesting. Two years ago, the Python book market was approximately one sixth the size of the Perl book market. As of this week (I just checked), it was 2/3 the size of the Perl book market. Fortunately, we're the leading publisher in both markets, with 72% share in Python, and 61% share in Perl. (As a side note, our Perl share is down from the high 80s a couple of years ago largely due to the increased sales of beginner's books like Perl for Dummies. Mike Hendrickson, my associate publisher for our Professional Books unit, who used to be the editor-in-chief at Addison-Wesley, reported the same thing for C and C++ in the 90s. After many years, AW's dominance was suddenly challenged by low-end books once the language became really mainstream. While this may not be good news for our share, it's a good sign that Perl is no longer restricted to the "alpha geeks.")
Another really interesting technical trend data point is the fate of books on Red Hat Linux. The Red Hat book market took a huge fall with the introduction of Fedora, from which it hasn't recovered. The Red Hat book market is down 29% from the same period in 2004, while Linux as a whole is up 32%. The strongest part of the market is now once again distribution-agnostic Linux books, with the exception of our bestselling Knoppix Hacks.
A Little Shameless Self Promotion
Our contract with Bookscan only allows us to share the data outside the company in conjunction with promoting our books. So I hope you can excuse the plugs for various O'Reilly books throughout the preceding discussion. But...in for a penny, in for a pound :-)
O'Reilly was the only major publisher to show growth quarter by quarter throughout 2004, and to show 2005 Q1 numbers above a year ago. We like to think that's a testament not only to the quality of our books, but also to the "O'Reilly Radar." You are a big part of that radar -- so keep the ideas for books coming. Even if you don't want to write a book yourself, be sure to let us know if there's something that you think would make a great book. You can email me directly, or to proposals at oreilly.com. Writing for O'Reilly has more information.
tags:
| comments: 17
| Sphere It
submit: ![]()
![]()
![]()
![]()
0 TrackBacks
TrackBack URL for this entry: http://blogs.oreilly.com/cgi-bin/mt/mt-t.cgi/3986
Comments: 17
is obvius that no newcomer is nuts enough to learn perl when there are faar better alternatives like python,php,ruby.
C/C++ and lisp will always have its place but perl is totally going down, enough with "write-only" encripted code in opersource please!
Using data on computer book sales as an indicator of software, business, and even economic trends, as a means of guiding us (writers and publishers) toward topic areas of increasing relevance, is an interesting concept. This is like a "trailing indicator" published by a government economic board.
A few months ago, I wonderered "Can computer book writers and publishers create the next golden age?" (posted at MathematicalAnalysis.com/blog).
An interesting question: can we use changes in the "trailing indicators" (i.e., the Oreilly topic database), combined with insight into current events and directions (from reading our software and business publications), to assess and possibly forecast what published resources will be needed by software developers (and businesses, since they buy the software development) 6 months or a year or 3 years into the future? -- thus, creating a "leading indicator" of topics likely to be of key importance in the coming months and years?
Wouldn't that be interesting!
Very interesting! Wish I had the Bookscan data to analyze :-) By the way, did Fedora books pick up any of Red Hat loss? Also, where would you put the new wave of "blogging for business" titles?
Fedora was included in the "Red Hat" category (and in fact, most publishers of RH-specific books ended up doing combo titles to cover RHEL and Fedora.) So, no, Fedora didn't pick up the slack.
We've got the 2002 crop of blogging books in a subcategory of web design and development called "social web" (along with other social web applications like wikis, as follows:
All >> web des & dev >> web other >> social web >>blogging
That first wave of books on blogging never did that well, and it's not a flourishing category. The new business blogging books haven't hit Bookscan yet. I'm not sure we would put them in the same place.
This of course raises the issue that categorization is difficult and almost always wrong over time. Clay Shirky gave a great talk on the subject at etech called Ontology is Overrated. This is why we're so interested in the way that search has replaced directories, and why the style of tagging used by Flickr and del.icio.us is becoming so popular.
We in fact started to build our ontology "bottom up" with a tagging approach -- we treated all of the words in a book's title as tags, and assembled clusters based on those "tags." But then we had to decide on non-overlapping categories for each book, because in the end, we're looking to count the members of each category, not to find them. (Is a PHP and MySQL book counted as a PHP book, a MySQL book, or a member of a separate category of books that cover both topics? When you sum the categories, how do you make sure you're not counting twice?) We tried to keep some of the flexibility of tagging by creating different dimensions in our data warehouse, so we can sum along not just categories but other dimensions such as operating system, programming language, database, etc.
let's hope that Date's book (hardcore database, one hopes) does well, and that database literacy really comes to the profession.
i'd *really* like to see Middlegen, and data centric development generally, get the attention it deserves: semantic web -- Bah Humbug.
Tim, Your discussion of using book sales data as technology inidicator got me thinking about trends in computer book topics (http://naba.typepad.com/nabatech/2005/04/trends_in_popul.html) and I thought the topics that tend to be popular are the ones that focus on the highest level of abstraction of a specific technology that is being embraced by software developers (and perhaps users as well). The other set of perennially popular topics include the basics (operating systems, databases, programming languages) that are always going to have some demand. I always admired how O'Reilly always keeps its titles in print- - that's something many publishers don't; they tend to go with the latest hot topic. Without giving away any of your secrets, could you comment on how you figure out what topics are "bookworthy?"
I have found this article as extremely insightful.
As an Operating Systems enthusiast (Instructor)
I constantly search for new ideas or trends in OSes.
Actually my question might be: What new services are being considered or required or need to be provided in the near term to make an OS more efficient in its basic objective such as "to allocate and manage computer resources?".
Of course I see the rise in interest for the Mac OS X and respect Apple's front running innovations in multimedia.
What are some of the things that differentiate the current OSes, in terms of functionality or needed functionality?
Maybe I just haven't come across it yet but it would be cool if you guys had a heatmap like this or some graph to show visitors your Top 10 or so selling books.
I'm looking for data on the dimensions of your books, I am helping to manage a warehouse for a bargain book distributor. We are currently either looking up the info online or measuring ourselves, I thought I would take a chance and ask you. Any help or leads in the right direction would be great. Wonderful article, love your books.
Thanks,
Joe
Joe, I think the Amazon API will give you dimensions of any book they carry. See:
http://docs.amazonwebservices.com/AWSEcommerceService/2006-03-08/
i dont understand this i am trying to do an economics project and i need someone to help me....does anyone know what the statistics is for borders sales for a month?
There is a new technology just comming out. It is a BookSnap that let individual scan books and turn into PDF. See more detail for yourself at http://www.atiz.com It is a new technology that will change the world!
I am the author of Operation Broken Reed, a true story of how ten intelligence team members were successful in providing President Harry S Truman with information that was instrumental in preventing a third world war. Being that this is my first and only writing experience I had hoped to know how the book is selling as I made a solemn promise to tell the story to the world should I outlive its top secret classification. Perhaps you may help me to understand how I may keep up on knowledge of the sell of Operation Broken Reed.
Many Thanks,
Art Boyd
We're currently either looking up the info online or measuring ourselves I thought I would take a chance and ask you.
Using books as a evidence to show the popularity of a programminglanguage is very questionable.
Todays programmers grow up with the internet and young people tend to read less books then ever before.
Several programming languages d have excellent on-line documentatie (look at Python's newest documentation as an example). Excellent tutorials, youtube movies and so on are helping people to master a programming language.
I challenge O'Reilly to create a better and more realtime WEB2.0 based system. Counting book selling alone doesn't say so much today when there are so many alternatives to learn about computer programming languages.
Would you grap a book to find a solution to a problem or just Google for it??? Let me guess.... google!
Post A Comment:
STAY CONNECTED
RECENT COMMENTS
- Peter on Book Sales as a Technology Trend Indicator: Using books as a eviden...
- Michael on Book Sales as a Technology Trend Indicator: We're currently either ...
- Lt. Col. (Ret) Art Boyd on Book Sales as a Technology Trend Indicator: I am the author of Oper...
- Booker on Book Sales as a Technology Trend Indicator: There is a new technolo...
- Nice on Book Sales as a Technology Trend Indicator: Very interesting and pr...
- terra on Book Sales as a Technology Trend Indicator: i dont understand this ...
- Marc Hedlund on Book Sales as a Technology Trend Indicator: Joe, I think the Amazon...
- Joe Young on Book Sales as a Technology Trend Indicator: I'm looking for data on...
- BillyG on Book Sales as a Technology Trend Indicator: Maybe I just haven't co...
- paulc on Book Sales as a Technology Trend Indicator: I have found this artic...
RADAR TOPICS
openoffice user [04.23.05 07:58 PM]
O'Reilly hs an OpenOffice.org book.
Can you post about the growth of
OpenOfiice.org and StarOffice book market?
thanks