
State of the Computer Book Market, Part 3
In this segment, I'll look at how publishers fared in the first quarter. The figure below shows the treemap for publisher performance in units sold versus the same period last year. As you can see, the market as a whole grew about 7%. The top-performing publisher in terms of increased unit sales was the Pragmatic Programmers, with 294% growth, followed by APress' Friends of Ed imprint, up 235%, and Thomson's Course Technology unit, up 230%. Among the "majors" (Pearson, Wiley, O'Reilly, Microsoft, and McGraw Hill), only Wiley and O'Reilly outperformed the market. (Click on the image below to pop up an enlarged version.)
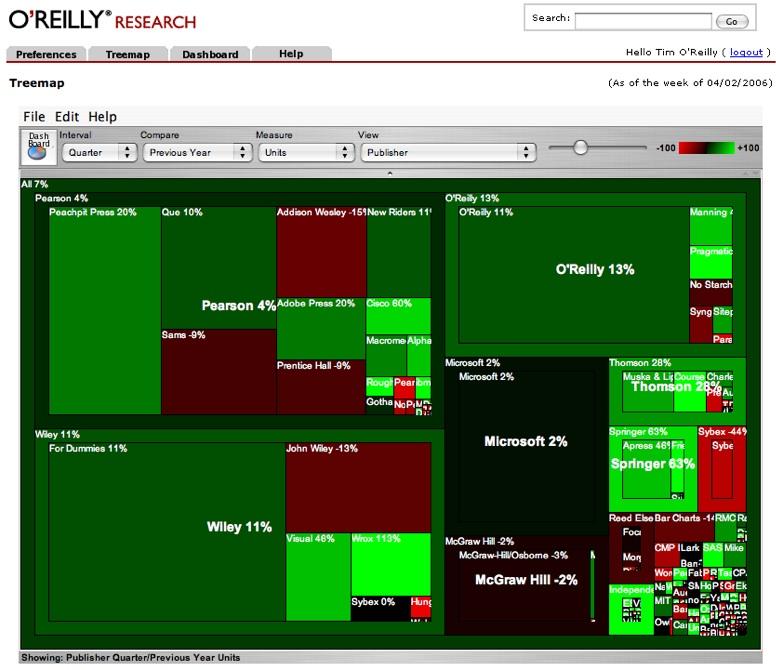
Pearson, the largest computer book publishing conglomerate, was up 4%, helped mostly by strong performance at Peachpit (up 18%), Adobe Press (up 19%), Macromedia Press (up 27%) and Cisco Press (up 62%). Wiley was up 11% overall, with Wrox (up 116%) and Visual (up 46%) leading their growth. O'Reilly was up 13% overall, including distribution clients (we distribute the Pragmatic Programmers, Manning, No Starch, Sitepoint, Syngress and Paraglyph) and 11% in its own publishing program. Microsoft Press was up only 2%, while McGraw-Hill continued its decline, off another 2%.
As Gary Cornell of APress pointed out when I saw him at Microsoft's Mix06, his strong growth rate coupled with Addison-Wesley's lackluster one puts APress on track to be larger than Addison-Wesley by year end, which would make him #2 after O'Reilly in professional computer book publishing. However, the competitor we have our closest eye on is Wrox, which is resurgent under new management at Wiley. (Of course, it helps that we're partnering with Pragmatic, Manning, and some of the other up-and-comers :-) Wiley picked up Wrox's top 35 titles when it went out of business, and Gary Cornell picked up the rest at APress. Wiley's strong performance with these titles (and new ones they've added since) shows how smart they were to cherry pick the list. While APress' growth has largely been driven by the publication of large numbers of titles (funded by APress' parent and distributor, Springer Verlag), Wrox is getting a lot of bang from each title, with average revenue per title in Q1 of over $19,000, vs. about $13,000 per title at APress.
That being said, Apress is getting a good rep among our "alpha geek" audience. One long-time friend wrote to me: "The Apress books are starting to appear on programmer bookshelves in droves (including mine), and Apress is getting a rep around the guys who work for me as an imprint you can buy sight unseen. Wrox won't ever get that rep back, if it ever had it. (The only other publishers I do that with are Tor and you....)"
A couple of other notes: (1) Peachpit's strong performance is somewhat deceptive, since 14% of its entire sales this quarter came from a single new title, Scott Kelby's phenomenally successful iPod Book, which sold nearly 30,000 copies via Bookscan-reporting stores in the quarter. (2) Of the top 50 titles, Wiley had 17, Pearson had 13, O'Reilly had 10, Microsoft had 8, and McGraw Hill had 2. No other publisher had more than 1.
Publisher Dashboards
In our data warehouse, the treemap is an interface to a series of data dashboards that allow us to drill down through the various dimensions, reaching title-level detail in only three clicks. We can also use this dashboard functionality to look at publisher market share and performance. The figure below shows a portion of the publisher data dashboard.
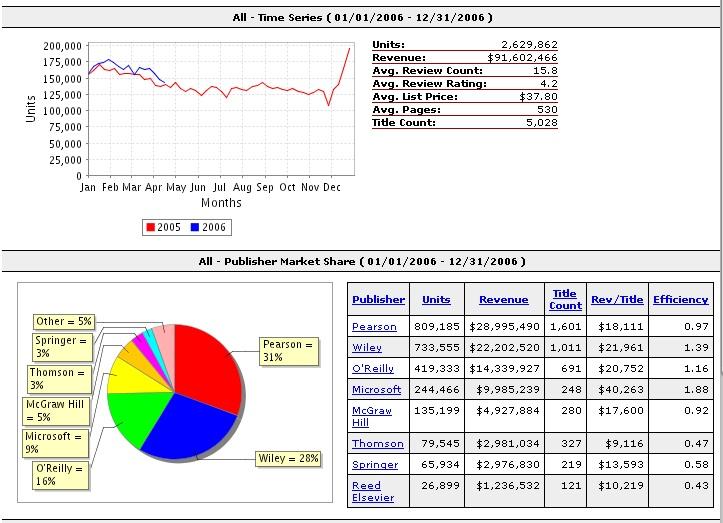
The trend chart at the top shows the year-on-year trend for the entire market, which I discussed in a previous posting.
The pie chart shows publisher market share across the entire industry. Pearson (including Addison-Wesley, Prentice-Hall, Cisco Press, Sams, Que, Peachpit, Adobe Press, Cisco Press, and Macromedia Press among other imprints) is the largest player, with 31% market share, followed by Wiley (including the Wiley, For Dummies, Wrox, and Sybex imprints) with 28%, O'Reilly (including distribution clients such as the Pragmatic Programmers, Manning, and No Starch), with 16%, Microsoft with 9%, McGraw-Hill with 5%, and Thomson and Springer (APress) with 3%.
The table to the left of the pie chart shows the actual unit sales reported by Bookscan, plus a dollar value calculated by multiplying the units by the retail price of each book. Keep in mind that this is not the actual dollar value (or total unit sales) for each publisher. Bookscan reports perhaps 70% of US book sales, or about 50% of worldwide English-language book sales. Books are typically sold at a discount to the bookstore, with the discount depending on the type of book. Most consumer-oriented books are sold to retailers at a 50% or greater discount, while some professional books are sold at a discount of either 32 or 37%. These two factors offset each other, so the reported revenue is likely in the ballpark, but it's nowhere near exact. It also doesn't take into account other non-bookstore channels of distribution.
The title count shown is not the total title count of the publisher in question. It is the title count of books in the category that had at least one sale reported via Bookscan during the quarter. A publisher may have additional books in print that had no Bookscan sales during the period.
Perhaps the most interesting figures for would-be authors are the Revenue/Title and Efficiency fields. As you can see, the revenue per title varies wildly, with Microsoft Press delivering nearly twice the revenue per title of any other publisher. This is because of the very high price of some of their reference sets, which can be in excess of $200. But those books also sell very well! Microsoft also does very well with some of its low-priced, high-volume series like Step-by-Step, leading to an average revenue per title for the quarter of over $40,000. Wiley and O'Reilly are clustered at about $21,000, with Pearson and McGraw-Hill around $18,000, and with Springer (APress), Thomson, and Reed Elsevier trailing far behind.
The efficiency field shows the percentage of the total units sold divided by the percentage of the total title count. A title efficiency value higher than one means that that publisher's titles exceed industry averages in unit sales performance, while a value below one means that publisher's titles are below industry averages. Again, Microsoft Press is far and away the top performer against this metric, followed by Wiley (For Dummies) and O'Reilly. These are the only three major publishers with a title efficiency higher than one. (Several of O'Reilly's distribution clients who are too small to be shown at this level of detail, notably Manning and the Pragmatic Programmers, also have high title efficiency.)
Another way to view this efficiency value is to see it as the number of titles a publisher needs to publish in order to achieve a certain level of sales. So, for example, while APress and Thomson showed high growth, they did it by publishing many more titles, not by publishing titles that, on the whole, performed exceptionally well. (This is not to say that they don't have any bestsellers, just that their overall program is less efficient than those of competitors.) Manning and Pragmatic, on the other hand, had strong growth as a result of high title efficiency, as did Wiley's Wrox imprint.
Here's how publishers fared by category. (See yesterday's post for a description of the major categories.)
Systems and Programming
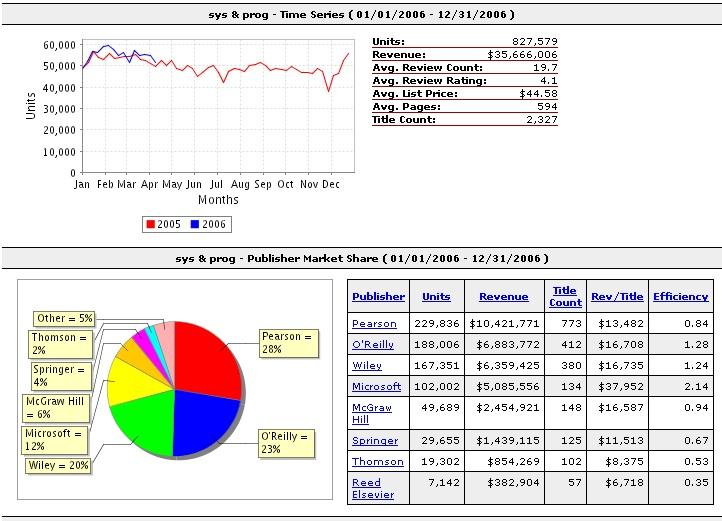
The trend chart at the top shows the year-on-year trend for this category only. As you can see, this category is only marginally ahead of last year.
The pie chart shows publisher market share for this category. Pearson (including Addison-Wesley, Prentice-Hall, Cisco Press, Sams, Que, among other imprints) is the largest player in the professional programming and administration space with 28% market share, followed by O'Reilly (including distribution clients such as the Pragmatic Programmers, Manning, and No Starch), with 23%, Wiley (Dummies, Wrox, and Sybex) with 20%, Microsoft with 12%, McGraw-Hill with 6%, and Springer (APress) with 4%. Microsoft Press has far and away the highest title efficiency in the professional programming category, followed by O'Reilly and Wiley.
Web Design and Development

As you can see, the Web Design and Development category is trending well above last year. Pearson is the largest publisher in the category, with 37% share, followed by Wiley with 24%, and O'Reilly with 22%. Springer (APress and Friends of Ed) is tied for fourth place with Microsoft, with 6% apiece.
O'Reilly delivered the highest revenue per title, followed closely by Microsoft. Microsoft and O'Reilly are also tied for first place in title efficiency. Pearson is also above average in efficiency, with APress, McGraw-Hill and Thomson trailing badly.
Digital Media Applications
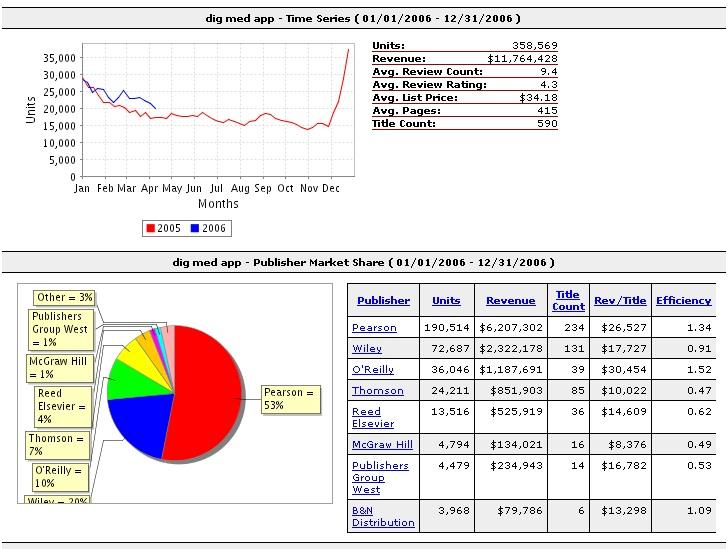
The digital media category is growing strongly year over year. On the trend graph, note the size of the holiday spike, which dwarfs that for professional publishing areas like Systems and Programming or Web Design and Development.
Pearson, with its Peachpit, Adobe Press, and Macromedia Press imprints, is far and away the gorilla in the digital media category, with 53% market share, followed by Wiley at 20% and O'Reilly at 10%. Thomson, growing fast in this space, is now at 7% share. But we're pleased to see that O'Reilly is the most efficient publisher, as entering this category was a strategic departure from our core programming and web development categories. As an illustration of how title efficiency works, you can see that we've achieved 50% of the unit sales of Wiley with only 29% of their number of titles, and 50% more unit sales than Thomson with fewer than half as many titles.
Our strength in this area is driven by the success of titles such as Photoshop CS 2 One on One, Photoshop Elements 4: The Missing Manual, iPhoto 6: The Missing Manual and The Photoshop Photo Effects Cookbook.
Consumer Operating Systems and Devices
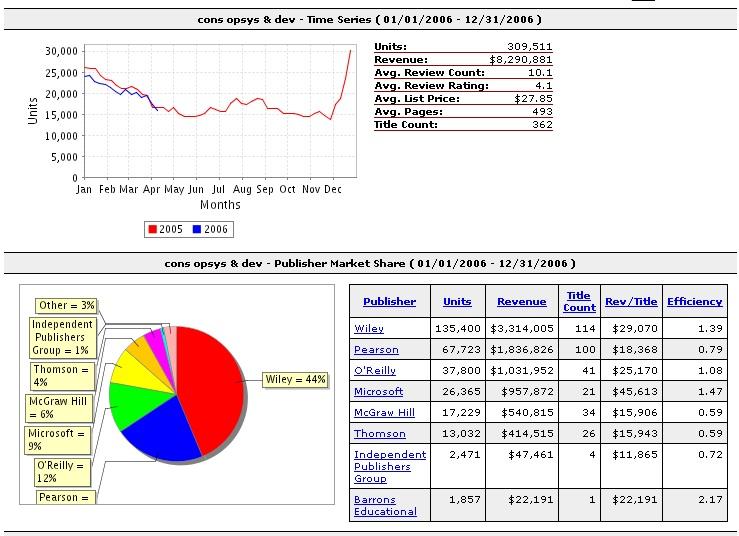
Wiley, with its For Dummies line, remains the dominant publisher in the shrinking category of books on consumer operating systems, with a 44% share. Pearson has 22%, O'Reilly 12%, and Microsoft 9%. Again, only Microsoft, Wiley, and O'Reilly have a title efficiency value greater than one.
Once again, note the very strong holiday spike in this category.
Business Applications
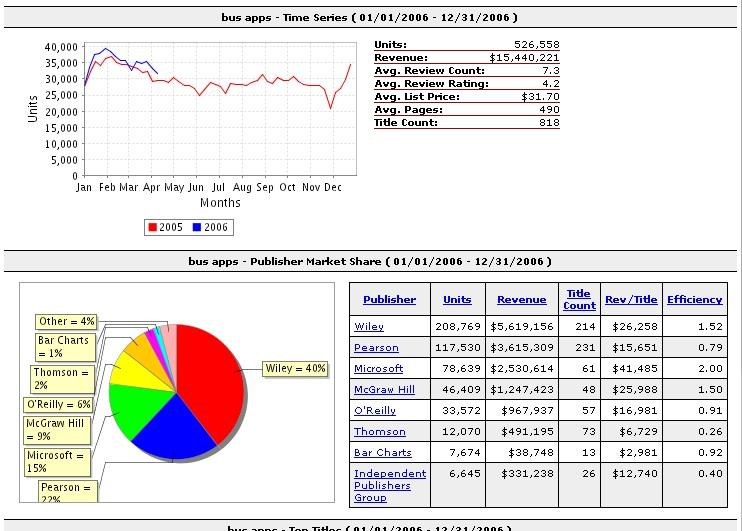
In business applications, Wiley is again the dominant player, with 40% market share, followed by Pearson at 22%, Microsoft at 15%, McGraw-Hill at 9%, and O'Reilly at 6%. In this category, Microsoft, Wiley, and McGraw-Hill all have strong title efficiency. It's the only major category where we haven't quite been able to outperform at O'Reilly. Despite the success of books like Quickbooks: The Missing Manual or Excel Hacks, this is not an area we've mastered! Microsoft Press and McGraw-Hill benefit from their strong position as "official" publishers, Microsoft for their own software, and McGraw for companies such as Intuit and eBay. Wiley of course does well in this space because of the dominant For Dummies brand.
Next week: Bestseller Lists
tags:
| comments: 13
| Sphere It
submit: ![]()
![]()
![]()
![]()
0 TrackBacks
TrackBack URL for this entry: http://blogs.oreilly.com/cgi-bin/mt/mt-t.cgi/4594
Comments: 13
A very interesting data set would be: what's the average total sales for a single title over its entire lifetime for each publisher. This is a different kind of efficiency, but one that must surely be a critical determinant of a publisher's (and an author's) "bottom line". Publishing is a very much "front-loaded" industry, involving a huge amount of effort and expense prior to the first sale. So, enduring sales per title is the ultimate efficiency, I'd think.
For authors, yes, there's the advance (unless you're going it alone as I am for my first book), but in terms of a career I still look at it as a front-loaded business. I'd consider the project a failure if I didn't earn out the advance and move into a kind of quasi-backlist enduring sales pattern where the publisher and I both considered the book a success and our working partnership a success.
So, is such data readily available? Average lifetime (or, say, trailing 5-year) total sales per title per publisher?
I'd think O'Reilly probably does well on such a statistic.
Dr. Nic -- Remember that these numbers are for a quarter's worth of sales only, and that they are an average for the given publisher across hundreds of books (thousands for Wiley and Pearson.) For example, O'Reilly's average for the quarter shows as $14,000 -- but our #1 book generated about $400,000 in the quarter; titles at the bottom of the list generated only a few hundred dollars.
As Kevin points out, the really important value is lifetime sales, which is a product not just of how well a book sells, but for how long. Our top titles, books like Programming Perl, Java in a Nutshell, JavaScript: The Definitive Guide, Mac OS X: The Missing Manual, Head First Java, etc. are all multimillion dollar books. I don't think we have any that have cracked $10 million, but there are a number of long-lived titles that are heading towards that territory (albeit usually with multiple editions.) Some of Wiley's top titles like Windows xx for Dummies, have lifetime sales in the tens of millions. Most computer book publishers are hoping to get lifetime sales of at least $100,000 from a book. (They used to hope for $200,000, but expectations have diminished since 2001 :-)
And yes, O'Reilly does well on such a statistic. We have a great batting average for books that "live long and prosper."
Kevin, we don't have easy "lifetime" stats for all publishers because our data on other publishers only goes back to 2003, and many of the top titles are older than that.
But back to Dr. Nic -- for some types of titles, self-publishing, or monetizing your content via a blog, might indeed be a better option. But this is a complex issue. I responded at length about this subject in the comments on David Hennemeier Hanson's piece "Shaking Up Tech Publishing," which can be found at http://www.loudthinking.com/arc/000580.html
Dr Nic's question is great, and as a veteran computer book author and revenue-earning blogger, I can probably provide an answer.
The blog form doesn't reward testing. Book writing does.
That's a little trite, I know, but it's the heart of the issue. When you write in the long form in any discipline or mode -- computer, nature, psychology, or fiction -- you develop a larger feel for the subject at hand that informs the entire work. It's why a Ph.D. isn't a series of 15 short essays, but a gesamtkunstwerk that requires sufficient scope and originality to go beyond the short form.
When I write a computer book, whether for print or the newer ebooks I've written for the Take Control series at TidBITS, I spend so much time with the application, the programming language, or the technology that I know which parts work together in which fashion. As I test and write, I go back and revise other parts of the whole. As readers provide feedback -- especially great with ebooks -- I re-test and revise again.
It's both an experimental and iterative process that requires having control over the entire scope of work.
Writing blog entries is a different matter, because although they can be informed by your entire set of knowledge on an issue, they tend to be small enough (as Dr Nic points out) that they're not painful to write in most cases. The pain in writing comes from reconciliation--how to take many different facets and produce something meaningful and useful. (The difference between ficiton and non fiction is that you can be meaningful and not useful in fiction, which may be less freeing than it sounds.)
Now let's get to the reward, too, because I said the blog form doesn't reward testing. You could spend 20 hours figuring out how to accomplish some sophisticated (or often simple) task in JavaScript or CSS or in Photoshop and perhaps it becomes a 1,000-word blog entry. That entry doesn't get monetized in the way a chapter does in a print or ebook that's for sale.
Even with lots of traffic to a Web blog and Google AdSense ads and banner ads, the relative financial return for any given blog entry--except ones that might have a disproportionate level of interest--is quite low.
A book averages out that return by factoring in that some tasks written about take very little or no research and testing--you already know how to do it, you're just documenting it--while others take an enormous amount of time. I know while writing some editions of the Adobe GoLive book that Jeff Carlson and I produced for Peachpit several years ago, there were sometimes entire days that led to a few pages of the book. Other days, I might write and produce images for 10 pages of the book.
You can make part of a living as a computer book author, but it's been trickier for the majority of us in the last four years. I don't know many computer book authors who only write books; many speak at conferences, write articles, consult privately, and even program or design on the side. Their non-book work brings insight that they put into their book work, too.
The only way to do well as a computer book author (true for most authors of all kinds) is to have many books in print. Search on Tom Negrino and Dori Smith, a productive married couple and friends of mine, and see how many books they've written. Look at my officemate Jeff Carlson -- ditto.
You can't write one book a year unless you get a Kelby or Pogue like return on that book. And both of those guys are production machines with imprints, and they're not writing (or supervising) one book a year by any means.
Tim, thanks for the link to the very interesting discussion at loudthinking.com.
What Glenn says reminds me of a lot of what I've learned from the Computer Book Publisher's mailing list (hosted by studiob.com). It's difficult to make an entire living from technology writing, though certainly some people do it. On the CBP list people say that writing articles pays better, which, if you've got a regular "gig" with the very top publications, sure, that's believable. I haven't heard any "regular person" say they make a huge amount of money blogging. So, for professionals who are decent at writing, writing can enhance your professional career and add some money.
I'm actually trying to switch to full-time writing (and freelance editing, if I can find some work -- I did lots of it for the old Wrox and SAMS). But I'm not making this switch expecting to have the same income I've had previously. I expect my hourly rate to be much lower than my software consulting rate. And I am working much longer weeks than most people find tolerable as I make the conversion.
If my kids weren't leaving the house, I certainly wouldn't be moving in this direction. And, publishing my first book from my own imprint, I may well see my first 800 hours of effort produce less than minimum wage, that won't be a shock. On the other hand, it's possible I'll make a lot of money, because by good luck the topic will still be timely.
Writing is a tough business. As is publishing...
Tim - I read through your very interesting post with some care. However, I am not sure I agree with your methodology. My disagreement stems from the fact that I think that you are trying to analyse a bimodal market using the assumption it is a single market. I don't believe that all the listed publishers are really in the same market or, perhaps more precisely, that all of their titles are competing in the same market.
If I can illustrate: I write 'niche' technical books - thus far in the security and enterprise monitoring areas. I would put my work in the same category (and I hope the same quality) as O'Reilly classics such as Sendmail and Learning Perl. My primary audience is technical and probably in the IT/Computing industry.
At the other end of the market (and I am making a distance comparison here and NOT a quality one) are the 'how-to' and 'dummies' guides and the more consumer focused titles. The audience here is much more mass market and in many cases is the typical PC/digital camera/iPod owner or to cite a recent O'Reilly title - Ebay user. They are often non-technical and probably are not in the IT/Computing industry.
This 'consumer' market is of a significant size too. For example, when looking at the book 'Topic' headers on the O'Reilly home page I would say that five of the fourteen topics - Business & Culture, Design & Graphics, Digital Audio & Video, Digital Photography, Home & Office (and possibly six - as many of the Hardware titles are consumer focused) - seem mostly aimed at this 'consumer' market. Additionally, I would expect that whilst there may be some cross-over most members of the 'consumer' market would probably never buy a title from the 'technical book' market.
I see these two markets as individual and clearly distinct. Hence I think they need to be divided and compared as such in order to truly articulate the state of the 'computer book' industry. To use a comparison I coined recently (and one again based on market distance and not quality :)) - lumping both markets together is like comparing the market for a Thames & Hudson art book on Da Vinci with Dan Brown's The Da Vinci Code. Apples and rocket ships.
Since Tim was kind enough to post his response to my comments on his post that I made at my blog (http://ablog.apress.com/?p=1054#more-1054), I thought I should return the favor. First off, while it's interesting to see Tim trying to respond to my criticisms by simply asserting again that his statistics are useful, he continues to miss the point: using simple averages in a multi-modal market is a statistical technique that can't give you any insight at all. Or, to put it another way, his repeated touting of his two numbers to show how much better O'Reilly is doing than Apress just shows the need to never forget Hamming's great insight that "the purpose of computing is not numbers but insight. Personally, I think that it doesn't take a PhD in math to decide that his two "averages" are the kind of "numbers" that give no insights what so ever into the problem that Tim is trying to analyze. When you have books as different as the great (and best selling) Head First series that Tim publishes or our equally great (if selling less than 1/10'th as well as a low selling Head First) book on the Time Network Protocols or our Practical Common Lisp that sells probably 1/4 as well as the average Head First book then I am contending that his "averages" are as about as meaningful as my statistics about our flagship .NET books outselling his--only the difference is that I made it clear in my post that I knew that my statistics were good only for "spin"
value and were not insightful at all. But, in the end all I can do is echo Tim himself and suggest that the reader judge for himself what is a meaningful statistic and what is not after reading my post and Tim's posts because there is really only one issue at stake here: is Tim's choice of average sales and relative efficiencies meaningful in this context? Finally, while I will be posting more later on my blog for those who are interested in seeing some more meaningful statistics, for now I simply suggest that people check out James Turnbull's (an Apress author by the way) thoughtful comment
(above) on Tim's original post.
Gary Cornell/Apress Publisher
Gary, you continue to miss or misrepresent my point. We compare like books -- the categories I show are a rollup of over 600 low level categories in a six level rollup. At first, you suggested that we were comparing dummies with high end technical books, and when I refuted that by pointing out that I'd discussed each of the major market categories, you suggest that the problem is that I'm comparing technical bestsellers with niche titles. I then responded with some specific analysis of your examples of C# and ASP.Net.
Two responses:
1. For several of the purposes of the analysis, comparing bestsellers with niche titles is perfectly valid -- after all, one of the purposes of the analysis is to help booksellers figure out their expected sales from various classes of books, and various publishers, or to help authors estimate their possible earnings.
2. As I showed in my response to the discussion of C# and ASP.Net, a drill down into more granular categories shows the same thing. There are very few categories where APress outperforms the competition, and most where it doesn't. If you want me to give the blow by blow through the 600 separate categories we track, I can. Sure -- there are a few areas where you are efficient (i.e. outperforming the competition) -- Lisp is a great example -- but those are areas where there is no competition. More power to you if you can make money publishing in those areas, but that doesn't make you a great bet for a retailer or an author who is trying to maximize his revenue.
Unlike you, I'm not trying to spin the data. I am trying to learn who's outperforming and why, so I can learn from them, and can advise my retailers and authors what's working in the marketplace and what isn't.
My conclusion regarding APress stands -- you have great books, but perhaps your sales representation leaves something to be desired, and you're getting less bang for your buck than the competition.
James (Turnbull) --
You suggest dividing the market and analyzing separate categories. As I mentioned in my original blog on the technique we use and in my reply to Gary, that's exactly what we do. At the lowest level, we've identified over 600 categories, which we roll up into the data I wrote about.
No Tim you are the one who isn't "getting it." Using simple averages in this context is statistically bogus, period. Nothing you have said (or can say) can escape this statistical fact. But here's a way that can perhaps make it clearer to you just what you are doing wrong: to compare the sales of your relatively recently published Java books which contains many wonderful (and extraordinarily well deserved) best sellers like the Java Head first books to another publisher's Java line using a simple average is to say nothing that a prospective author should find of interest. It's just meaningless statistical noise.
Tim
Isn't that my point - the roll-up? You're rolling up all the categories and saying O'Reilly has this share of the market and these other players have these shares of the market? What if some of the players aren't represented in one or more of the categories? Are you really comparing them? Surely the players are only competing in the categories (or markets perhaps) which they are present? Hence my comment about bi-modal (or more) markets.
I guess I don't, Gary. If you are confident that the fact that you get 15% of O'Reilly's sales from 31% the number of titles, or 26% of the unit sales of Microsoft Press from 88% the number of titles, or only four and a half times the unit sales of Pragmatic with fifteen times as many titles, is "meaningless statistical noise," then you can rest easy. I certainly agree that a publisher's "batting average" doesn't predict the performance of any individual title, but it does say something fairly powerful about the aggregate performance of the publisher's list.
I like your books. I'd love to distribute them, as we do Manning, and Pragmatic, and No Starch, and a number of others. I didn't start this thread to discredit you. I merely reported on who's winning and who's losing in the marketplace, and while you've shown nice growth, you've done so by publishing a lot of titles -- unlike, say Manning or Pragmatic, who've shown their growth by hitting the ball out of the park with a high percentage of their titles.
Because your books are very good, I can only conclude that Springer could do a better job on sales and distribution.
James --
Obviously, the data I gave in the posting was at the second level, for the five "market segments", but given that the efficiency figure is the ratio of share of titles to share of unit sales, the numbers actually tend to hold true up and down the category tree. (I gave some specific examples in my response on Gary's blog.)
A publisher doesn't have categories that they don't compete in counted against them. That's why, for instance, Pragmatic shows up with a very high efficiency. The categories they aren't in don't count against them, and they kick butt in the categories they are in. If you're not in a category, you have no share of title count, so it doesn't matter than you have no share of unit sales.
Like all averages, there are outliers. A publisher with ten out of a hundred books in a category achieving a 20% share (an efficiency of 2, significantly beating the rest of the market) could be doing it with one superstar and 9 dogs. A publisher with ten out of a hundred books achieving a 10% market share (an efficiency of 1, matching the market averages) could actually be doing better with most of their titles than the first publisher. (That is, I believe, Gary's point about the statistical failings of this technique.) But in practice, it turns out not to be the case, and in almost all cases we've observed, title efficiency is a really good measure of a publisher's "batting average."
Post A Comment:
STAY CONNECTED
RECENT COMMENTS
- Tim O'Reilly on State of the Computer Book Market, Part 3: James -- Obviously, th...
- Tim O'Reilly on State of the Computer Book Market, Part 3: I guess I don't, Gary. ...
- James Turnbull on State of the Computer Book Market, Part 3: Tim Isn't that my poin...
- Gary Cornell on State of the Computer Book Market, Part 3: No Tim you are the one ...
- Tim O'Reilly on State of the Computer Book Market, Part 3: James (Turnbull) -- Yo...
- Tim O'Reilly on State of the Computer Book Market, Part 3: Gary, you continue to m...
- Gary Cornell on State of the Computer Book Market, Part 3: Since Tim was kind enou...
- James Turnbull on State of the Computer Book Market, Part 3: Tim - I read through yo...
- Kevin Farnham on State of the Computer Book Market, Part 3: Tim, thanks for the li...
- Glenn Fleishman on State of the Computer Book Market, Part 3: Dr Nic's question is gr...
RADAR TOPICS
Dr Nic [04.21.06 12:50 AM]
I think some of these numbers possibly shed light on the boom in "How-to" blogs - if the average revenue for a "How-to" book is 20-30k (with Microsoft being able to claim upto 40k in some categories) and the author's share of that being significantly less, then perhaps a potential author might think "why bother? My blog articles are published instantly; I get feed back in my comments; I have no deadlines; My blog can be 200 to 2000 words instead of 50,000-300,000 words, and yet get right to the heart of the topic; and My blog articles are searchable on Google/Yahoo."
Yes, there is credibility in being a published author. Perhaps I don't understand the numbers behind the books - but how could someone make a living out of writing "How-to" technical books?
And if they can't make a living, and you just like sharing knowledge and/or having your name associated with new ideas, perhaps its easier to write a blog.
One other thought: nearly every book, of every type - fiction and non-fiction, includes an Acknowledgements section, where the last paragraph says:
But articles in "How-to" blogs don't. I infer from this that there is great pain in writing books - that's certainly what I found writing academic theses - and little pain in writing up, potentially the same content, in a blog.
As a publishing company, perhaps you could write an article one day on why do "How-to" authors put themselves through the process of book writing, and what are the rewards?