"data science skills" entries

Business analysts want access to advanced analytics
Business users are starting to tackle problems that require machine-learning and statistics
I talk with many new companies who build tools for business analysts and other non-technical users. These new tools streamline and simplify important data tasks including interactive analysis (e.g., pivot tables and cohort analysis), interactive visual analysis (as popularized by Tableau and Qlikview), and more recently data preparation. Some of the newer tools scale to large data sets, while others explicitly target small to medium-sized data.
As I noted in a recent post, companies are beginning to build data analysis tools1 that target non-experts. Companies are betting that as business users start interacting with data, they will want to tackle some problems that require advanced analytics. With business analysts far outnumbering data scientists, it makes sense to offload some problems to non-experts2.
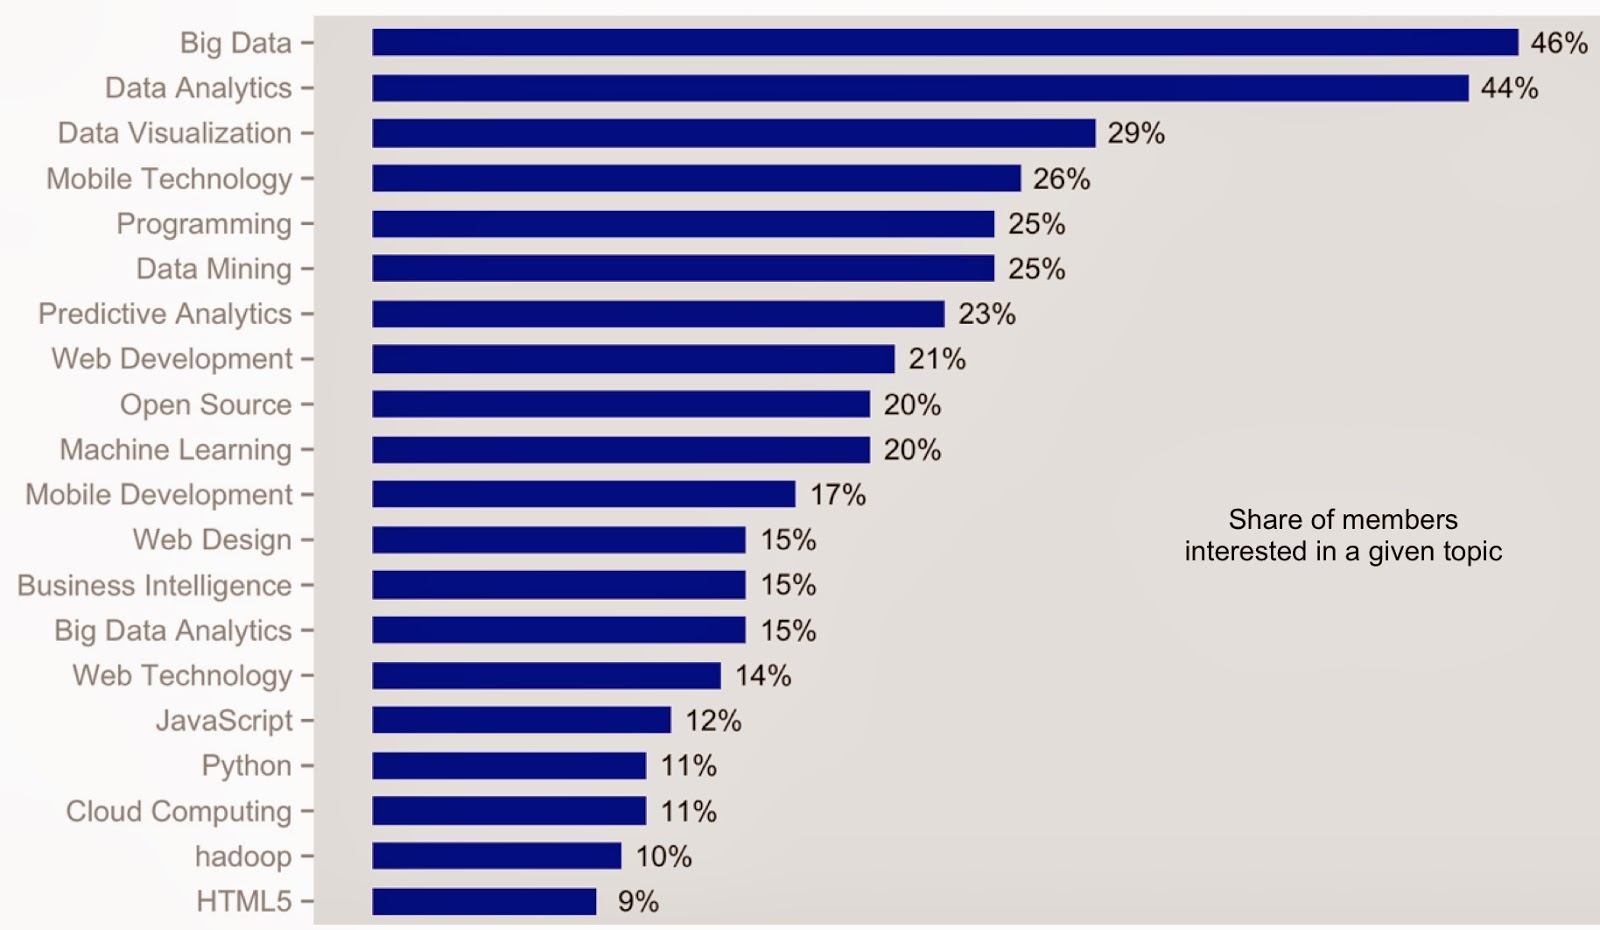
Moreover data seems to support the notion that business users are interested in more complex problems. I recently looked at data3 from 11 large Meetups (in NYC and the SF Bay Area) that target business analysts and business intelligence users. Altogether these Meetups had close to 5,000 active4 members. As you can see in the chart below, business users are interested in topics like machine learning (1 in 5), predictive analytics (1 in 4), and data mining (1 in 4):
Data Wrangling gets a fresh look
We are in the early days of productivity technology in data science
Data analysts have long lamented the amount of time they spend on data wrangling. Rightfully so, as some estimates suggest they spend a majority of their time on it. The problem is compounded by the fact that these days, data scientists are encouraged to cast their nets wide, and investigate alternative (unstructured) data sources. The general perception is that data wrangling is the province of programmers and data scientists. Spend time around Excel users and you’ll learn that they do quite a bit of data wrangling too!
In my work I tend to write scripts and small programs to do data wrangling. That usually means some combination1 of SQL, Python, and Spark2. I’ve played with Google Refine (now called OpenRefine) in the past, but I found the UI hard to get used to. Part of the problem may have been that I didn’t use the tool often3 enough to become comfortable.
For most users data wrangling still tends to mean a series of steps that usually involves different tools (e.g., you often need to draw charts to spot outliers and anomalies). As I’ve pointed out in previous posts, workflows that involve many different tools require a lot of context-switching, which in turn affects productivity and impedes reproducability.
We are washing our data at the side of the river on stones. We are really in the early, early ages of productivity technology in data science.
Joe Hellerstein (Strata-NYC 2012), co-founder and CEO of Trifacta
Data analysis tools target non-experts
Tools simplify the application of advanced analytics and the interpretation of results
A new set of tools make it easier to do a variety of data analysis tasks. Some require no programming, while other tools make it easier to combine code, visuals, and text in the same workflow. They enable users who aren’t statisticians or data geeks, to do data analysis. While most of the focus is on enabling the application of analytics to data sets, some tools also help users with the often tricky task of interpreting results. In the process users are able to discern patterns and evaluate the value of data sources by themselves, and only call upon expert1 data analysts when faced with non-routine problems.
Visual Analysis and Simple Statistics
Three SaaS startups – DataHero, DataCracker, Statwing – make it easy to perform simple data wrangling, visual analysis, and statistical analysis. All three (particularly DataCracker) appeal to users who analyze consumer surveys. Statwing and DataHero simplify the creation of Pivot Tables2 and suggest3 charts that work well with your data. StatWing users are also able to execute and view the results of a few standard statistical tests in plain English (detailed statistical outputs are also available).
Statistics and Machine-learning
BigML and Datameer’s Smart Analytics are examples of recent tools that make it easy for business users to apply machine-learning algorithms to data sets (massive data sets, in the case of Datameer). It makes sense to offload routine data analysis tasks to business analysts and I expect other vendors such as Platfora and ClearStory to provide similar capabilities in the near future.
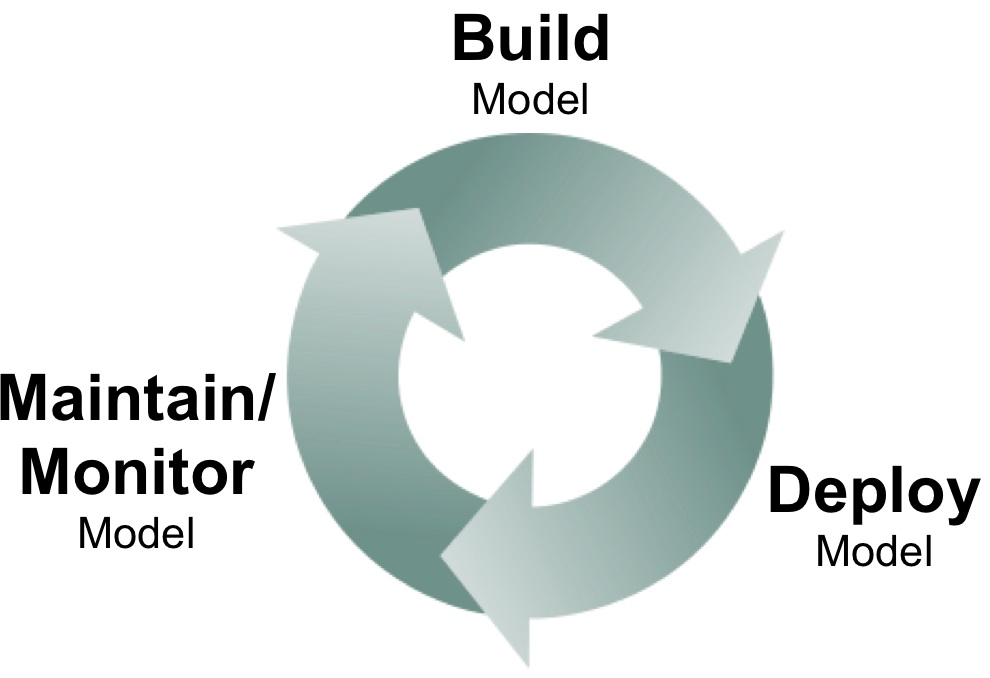
Data scientists tackle the analytic lifecycle
A new crop of data science tools for deploying, monitoring, and maintaining models
What happens after data scientists build analytic models? Model deployment, monitoring, and maintenance are topics that haven’t received as much attention in the past, but I’ve been hearing more about these subjects from data scientists and software developers. I remember the days when it took weeks before models I built got deployed in production. Long delays haven’t entirely disappeared, but I’m encouraged by the discussion and tools that are starting to emerge.
The problem can often be traced to the interaction between data scientists and production engineering teams: if there’s a wall separating these teams, then delays are inevitable. In contrast having data scientists work more closely with production teams makes rapid iteration possible. Companies like Linkedin, Google, and Twitter work to make sure data scientists know how to interface with their production environment. In many forward thinking companies, data scientists and production teams work closely on analytic projects. Even a high-level understanding of production environments help data scientists develop models that are feasible to deploy and maintain.
Model Deployment
Models generally have to be recoded before deployment (e.g., data scientists may favor Python, but production environments may require Java). PMML, an XML standard for representing analytic models, has made things easier. Companies who have access to in-database analytics1, may opt to use their database engines to encode and deploy models.

Improve your math skills
Practical advice for those considering a career in data science
When I was a youngster in college I found myself dissatisfied after I took a stats class from the math department. So I decided to take another stats class. Classmates thought I was crazy. Let’s be real, what precocious over-achieving teenager majoring in English lit seeks to retake a math class? And not because of a grade but because they were dissatisfied with what they didn’t get out of it? After a bit of research, I decided to take the stats class offered by the psych department.
It made a significant difference.
Thinking about math from the perspectives of research design methodology and how data can be used to manipulate people made quite an impact on my teenage worldview. This experience also reinforced my belief that education is what you decide it will be. There is always more than one way to learn and education doesn’t necessarily have to happen in a physical classroom. Growing up in the San Francisco Bay Area where friends and loved ones decided to forgo traditional higher ed completely to start their own companies or immediately work in jobs in technology also contributed to this belief.
While full time students who are looking at a career in data science may have the time to do seemingly nutty things like take overlapping math classes, this is not something that most people with full time jobs are able to do. When people with full time jobs ask me about what they need to do to move into data science, I probe them about the kind of job in data science they want and about their analytical and empathy skills. Then, I immediately follow up with “So, how are your math skills?.” Interestingly enough, I get a lot people saying how they don’t have time to physically go into a classroom or that it has been, like, forever since they’ve used statistics and/or linear algebra for data analysis. Even more interesting is how often people don’t realize just how many resources are available to learn math outside of the physical-attendance-in-a-classroom-model.
Huh. Read more…