- Trajectory Data Mining: An Overview (Paper a Day) — This is the data created by a moving object, as a sequence of locations, often with uncertainty around the exact location at each point. This could be GPS trajectories created by people or vehicles, spatial trajectories obtained via cell phone tower IDs and corresponding transmission times, the moving trajectories of animals (e.g. birds) fitted with trackers, or even data concerning natural phenomena such as hurricanes and ocean currents. It turns out, there’s a lot to learn about working with such data!
- Search Engine Manipulation Effect (PNAS) — Internet search rankings have a significant impact on consumer choices, mainly because users trust and choose higher-ranked results more than lower-ranked results. Given the apparent power of search rankings, we asked whether they could be manipulated to alter the preferences of undecided voters in democratic elections. They could. Read the article for their methodology. (via Aeon)
- Keshif — open source interactive data explorer.
- proselint — analyse text for sins of usage and abusage.
"time-series" entries

Four short links: 7 March 2016
Trajectory Data Mining, Manipulating Search Rankings, Open Source Data Exploration, and a Linter for Prose.
Four short links: 1 June 2015
AI Drives, Decent Screencaps, HTTP/2 Antipatterns, Time Series
- The Basic AI Drives (PDF) — Surely, no harm could come from building a chess-playing robot, could it? In this paper, we argue that such a robot will indeed be dangerous unless it is designed very carefully. Without special precautions, it will resist being turned off, will try to break into other machines and make copies of itself, and will try to acquire resources without regard for anyone else’s safety. These potentially harmful behaviors will occur not because they were programmed in at the start, but because of the intrinsic nature of goal-driven systems.
- PreTTY — how to take a good-looking screencap of your terminal app in action.
- Why Some of Yesterday’s HTTP Best Practices are HTTP/2 Antipatterns — also functions as an overview of HTTP/2 for those of us who didn’t keep up with the standardization efforts.
- Tisean — a software project for the analysis of time series with methods based on the theory of nonlinear deterministic dynamical systems. (via @aphyr)
Four short links: 5 May 2015
Agile Hardware, Time Series Data, Data Loss, and Automating Security
- How We Do Agile Hardware Development at Meld — In every sprint we built both hardware and software. This doesn’t mean we had a fully fabricated new board rev once a week. […] We couldn’t build a complete new board every week, and early on we didn’t even know for sure what parts we wanted in our final BOM (Bill of Materials) so we used eval boards. These stories of how companies iterated fast will eventually build a set of best practices for hardware startups, similar to those in software.
- Recording Time Series — if data arrives with variable latency, timestamps are really probabilistic ranges. How do you store your data for searches and calculations that reflect reality, and are not erroneous because you’re ignoring a simplification you made to store the data more conveniently?
- Call Me Maybe, ElasticSearch 1.5.0 — To be precise, Elasticsearch’s transaction log does not put your data safety first. It puts it anywhere from zero to five seconds later. In this test we kill random Elasticsearch processes with kill -9 and restart them. In a datastore like Zookeeper, Postgres, BerkeleyDB, SQLite, or MySQL, this is safe: transactions are written to the transaction log and fsynced before acknowledgement. In Mongo, the fsync flags ensure this property as well. In Elasticsearch, write acknowledgement takes place before the transaction is flushed to disk, which means you can lose up to five seconds of writes by default. In this particular run, ES lost about 10% of acknowledged writes.
- FIDO — Netflix’s open source system for automatically analyzing security events and responding to security incidents.
Four short links: 29 April 2015
Deceptive Visualisation, Small Robots, Managing Secrets, and Large Time Series
- Disinformation Visualisation: How to Lie with Datavis — We don’t spread visual lies by presenting false data. That would be lying. We lie by misrepresenting the data to tell the very specific story we’re interested in telling. If this is making you slightly uncomfortable, that’s a good thing; it should. If you’re concerned about adopting this new and scary habit, well, don’t worry; it’s not new. Just open your CV to be reminded you’ve lied with truthful data before. This time, however, it will be explicit and visual. (via Regine Debatty)
- Microtugs — a new type of small robot that can apply orders of magnitude more force than it weighs. This is in stark contrast to previous small robots that have become progressively better at moving and sensing, but lacked the ability to change the world through the application of human-scale loads.
- Vault — a tool for securely managing secrets and encrypting data in-transit.
- iSAX: Indexing and Mining Terabyte Sized Time Series (PDF) — Our approach allows both fast exact search and ultra-fast approximate search. We show how to exploit the combination of both types of search as sub-routines in data mining algorithms, allowing for the exact mining of truly massive real-world data sets, containing millions of time series. (via Benjamin Black)
Four short links: 15 April 2015
Facebook as Biometrics, Time Series Sequences, Programming Languages, and Oceanic Robots
- Facebook Biometrics Cache (Business Insider) — Facebook has been accused of violating the privacy of its users by collecting their facial data, according to a class-action lawsuit filed last week. This data-collection program led to its well-known automatic face-tagging service. But it also helped Facebook create “the largest privately held stash of biometric face-recognition data in the world,” the Courthouse News Service reports.
- The Clustering of Time Series Sequences is Meaningless (PDF) — Clustering of time series subsequences is meaningless. More concretely, clusters extracted from these time series are forced to obey a certain constraint that is pathologically unlikely to be satisfied by any data set, and because of this, the clusters extracted by any clustering algorithm are essentially random. While this constraint can be intuitively demonstrated with a simple illustration and is simple to prove, it has never appeared in the literature. We can justify calling our claim surprising since it invalidates the contribution of dozens of previously published papers. We will justify our claim with a theorem, illustrative examples, and a comprehensive set of experiments on reimplementations of previous work. From 2003, warning against sliding window techniques.
- Toolkits for the Mind (MIT TR) — Programming–language designer Guido van Rossum, who spent seven years at Google and now works at Dropbox, says that once a software company gets to be a certain size, the only way to stave off chaos is to use a language that requires more from the programmer up front. “It feels like it’s slowing you down because you have to say everything three times,” van Rossum says. Amen!
- Robots Roam Earth’s Imperiled Oceans (Wired) — It’s six feet long and shaped like an airliner, with two wings and a tail fin, and bears the message, “OCEANOGRAPHIC INSTRUMENT PLEASE DO NOT DISTURB.” All caps considered, though, it’s a more innocuous epigram than the one on a drone I saw back at the dock: “Not a weapon — Science Instrument.”
Four short links: 3 March 2015
Wearable Warning, Time Series Data, App Cards, and Secure Comms
- You Guys Realize the Apple Watch is Going to Flop, Right? — leaving aside the “guys” assumption of its readers, you can take this either as a list of the challenges Apple will inevitably overcome or bypass when they release their watch, or (as intended) a list of the many reasons that it’s too damn soon for watches to be useful. The Apple Watch is Jonathan Ive’s new Newton. It’s a potentially promising form that’s being built about 10 years before Apple has the technology or infrastructure to pull it off in a meaningful way. As a result, the novel interactions that could have made the Apple watch a must-have device aren’t in the company’s launch product, nor are they on the immediate horizon. And all Apple can sell the public on is a few tweets and emails on their wrists—an attempt at a fashion statement that needs to be charged once or more a day.
- InfluxDB, Now With Tags and More Unicorns — The combination of these new features [tagging, and the use of tags in queries] makes InfluxDB not just a time series database, but also a database for time series discovery. It’s our solution for making the problem of dealing with hundreds of thousands or millions of time series tractable.
- The End of Apps as We Know Them — It may be very likely that the primary interface for interacting with apps will not be the app itself. The app is primarily a publishing tool. The number one way people use your app is through this notification layer, or aggregated card stream. Not by opening the app itself. To which one grumpy O’Reilly editor replied, “cards are the new walled garden.”
- Signal 2.0 — Signal uses your existing phone number and address book. There are no separate logins, usernames, passwords, or PINs to manage or lose. We cannot hear your conversations or see your messages, and no one else can either. Everything in Signal is always end-to-end encrypted, and painstakingly engineered in order to keep your communication safe.
Four short links: 15 September 2014
Weird Machines, Libraries May Scan, Causal Effects, and Crappy Dashboards
- The Care and Feeding of Weird Machines Found in Executable Metadata (YouTube) — talk from 29th Chaos Communication Congress, on using tricking the ELF linker/loader into arbitrary computation from the metadata supplied. Yes, there’s a brainfuck compiler that turns code into metadata which is then, through a supernatural mix of pixies, steam engines, and binary, executed. This will make your brain leak. Weird machines are everywhere.
- European Libraries May Digitise Books Without Permission — “The right of libraries to communicate, by dedicated terminals, the works they hold in their collections would risk being rendered largely meaningless, or indeed ineffective, if they did not have an ancillary right to digitize the works in question,” the court said. Even if the rights holder offers a library the possibility of licensing his works on appropriate terms, the library can use the exception to publish works on electronic terminals, the court ruled. “Otherwise, the library could not realize its core mission or promote the public interest in promoting research and private study,” it said.
- CausalImpact (GitHub) — Google’s R package for estimating the causal effect of a designed intervention on a time series. (via Google Open Source Blog)
- Laws of Crappy Dashboards — (caution, NSFW language … “crappy” is my paraphrase) so true. Not talking to users will result in a [crappy] dashboard. You don’t know if the dashboard is going to be useful. But you don’t talk to the users to figure it out. Or you just show it to them for a minute (with someone else’s data), never giving them a chance to figure out what the hell they could do with it if you gave it to them.

Machine Data at Strata: “BigData++”
By David Andrzejewski of SumoLogic

Photo Courtesy of David Andrzejewski
A few weeks ago I had the pleasure of hosting the machine data track of talks at Strata Santa Clara. Like “big data”, the phrase “machine data” is associated with multiple (sometimes conflicting) definitions, two prominent ones come from Curt Monash and Daniel Abadi. The focus of the machine data track is on data which is generated and/or collected automatically by machines. This includes software logs and sensor measurements from systems as varied as mobile phones, airplane engines, and data centers. The concept is closely related to the “internet of things”, which refers to the trend of increasing connectivity and instrumentation in existing devices, like home thermostats.
More data, more problems
This data can be useful for the early detection of operational problems or the discovery of opportunities for improved efficiency. However, the decoupling of data generation and collection from human action means that the volume of machine data can grow at machine scales (i.e., Moore’s Law), an issue raised by both Monash and Abadi. This explosive growth rate amplifies existing challenges associated with “big data”. In particular two common motifs among the talks at Strata were the difficulties around:
- mechanics: the technical details of data collection, storage, and analysis
- semantics: extracting understandable and actionable information from the data deluge

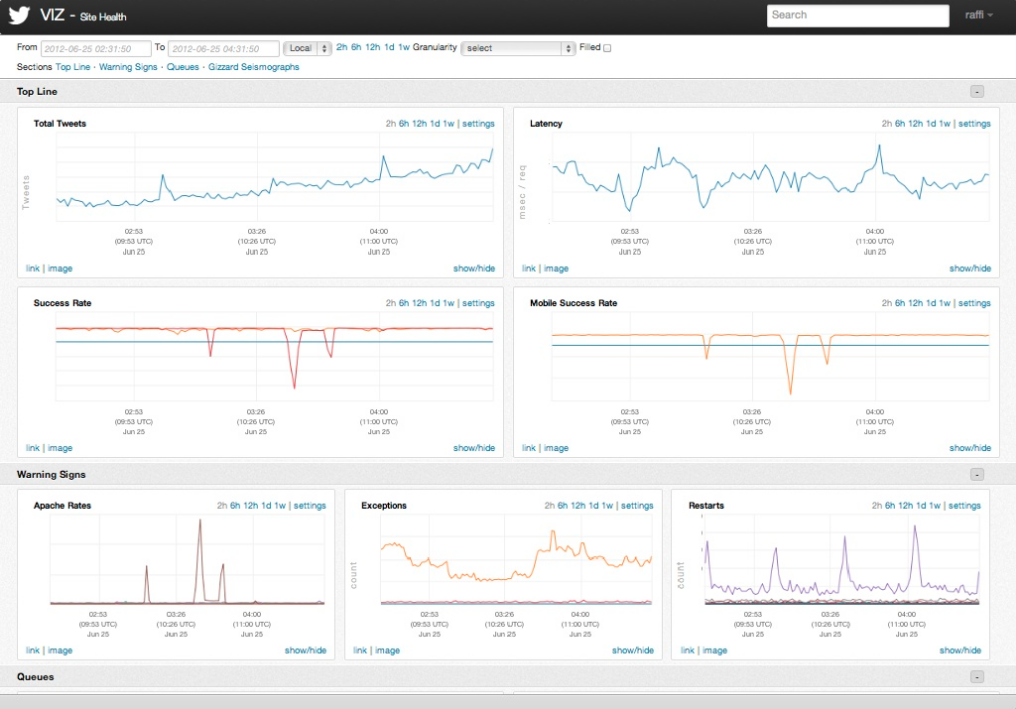
How Twitter monitors millions of time-series
A distributed, near real-time system simplifies the collection, storage, and mining of massive amounts of event data
One of the keys to Twitter’s ability to process 500 millions tweets daily is a software development process that values monitoring and measurement. A recent post from the company’s Observability team detailed the software stack for monitoring the performance characteristics of software services, and alert teams when problems occur. The Observability stack collects 170 million individual metrics (time-series) every minute and serves up 200 million queries per day. Simple query tools are used to populate charts and dashboards (a typical user monitors about 47 charts).
The stack is about three years old1 and consists of instrumentation2 (data collection primarily via Finagle), storage (Apache Cassandra), a query language and execution engine3, visualization4, and basic analytics. Four distinct Cassandra clusters are used to serve different requirements (real-time, historical, aggregate, index). A lot of engineering work went into making these tools as simple to use as possible. The end result is that these different pieces provide a flexible and interactive framework for developers: insert a few lines of (instrumentation) code and start viewing charts within minutes5.
Surfacing anomalies and patterns in Machine Data
Compelling large-scale data platforms originate from the world of IT Operations
I’ve been noticing that many interesting big data systems are coming out of IT operations. These are systems that go beyond the standard “capture/measure, display charts, and send alerts”. IT operations has long been a source of many interesting big data1 problems and I love that it’s beginning to attract the attention2 of many more data scientists and data engineers.
It’s not surprising that many of the interesting large-scale systems that target time-series and event data have come from ops teams: in an earlier post on time-series, several of the tools I highlighted came out of IT operations. IT operations involves monitoring many different hardware and software systems, a task that requires a variety of tools and which quickly leads to “metrics overload”. A partial list includes data captured from a wide range of application log files, network traffic, energy and power sources.
The volume of IT ops data has led to new tools like OpenTSDB and KairosDB – time series databases that leverage HBase and Cassandra. But storage, simple charts, and lookups are just the foundation of what’s needed. IT Ops track many interdependent systems, some of which might be correlated3. Not only are IT ops faced with highlighting “unknown unknowns” in their massive data sets, they often need to do so in near realtime.