
As I try to do each quarter, here’s a report on the state of the computer book market, as revealed by data from Nielsen Bookscan’s top 3,000 Computer Books report. (See my entry Book Sales as a Technology Trend Indicator for a description of our methodology.)
Unfortunately, the upturn I wrote about at the end of the first quarter stalled in Q2. While Q1 was consistently higher than any period since the bust in 2001, and looked like we might be about to break out of the narrow range of the past couple of years, Q2 bumped along at about the same level as last year, as shown in the graph below.
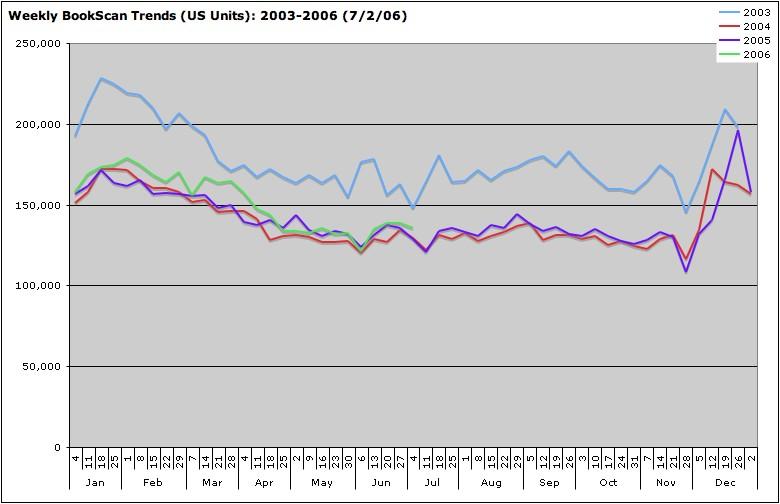
While the graph shows the weekly trend sometimes above and sometimes below the same period in 2005, the final total is a bit better than it might appear. The second quarter of 2006 was about 1.5% above the same quarter in 2005, with 1,781,390 units reported sold versus 1,753,735 in the prior period. We didn’t quite fall back to 2005 levels, but we didn’t see a continuation of or even a hoped-for increase over Q1’s 6% increase. Reported revenues for the quarter were up 3% over the same period in 2005, to $63,319,058, due to an increase in the average price of a computer book from $37.54 to $37.78. Note however that this increase doesn’t necessarily mean that prices are increasing overall — we see quite a bit of variance from quarter to quarter based on the mix of bestsellers.
(While I’ve written about this previously, a reminder that Nielsen figures do not represent the entire computer book market is in order. Nielsen claims that they report 65-70% of US bookstores; the US represents about 70% of the total English-language market. Accordingly, these figures represent perhaps 50% of the total market. Further, revenue figures shown in these reports are calculated based on unit sales times retail price of each book. However, because books are typically sold at a discount of more than 50% to retailers, while Nielsen is reporting on only 50% of the market, these two figures offset each other, and we’ve found that the resulting revenue figures are within spitting distance of actual publisher and total market figures. I should also remind you that these figures represent sell-through — that is, books that have actually been sold by bookstores. On royalty statements, publishers report sell-in — that is, books that have been sold to bookstores, but which may be returned after sitting on the shelves for a while. (That’s why many publishers have returns reserves in their royalty accounting.))
A few other overall market statistics that may be interesting: A total of 4,744 titles made it onto Nielsen’s Top 3000 computer books list at least once during the quarter. The average page count of books on the list was 526. The average count of Amazon reviews for books that made the list was 15.9, and the average review rating was 4.2.
While most of these statistics are in line with those from the same period a year ago, I was struck by the steady decline in the average review count. It was 17.5 in Q1 of 05, 17 in Q2 of 05, 16.4 in Q1 of 06, and 15.9 in Q2. I’m not sure whether this represents greater churn on the list, with more new titles, or an actual slowdown of reviewer activity for computer books on Amazon. A look back at Q1 of 2003 shows that this is part of a continued decline. The average review count in that period was 20.4.
On the upside, readers seem to be happier with the books they are reviewing. The average review rating in Q1 of 03 was 3.9 vs. 4.2 today. Readers might also take heart from the decline in average price. In 2003, it was $39.95 vs. $37.78 today. The average page count is also down, 526 today vs. 578 in Q1 of 03, when we first started tracking Nielsen’s data.
Tomorrow: Details on winners and losers by category.