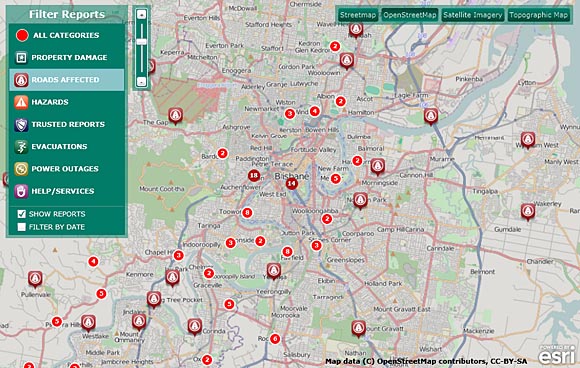
A new online application from geospatial mapping giant ESRI applies trend analysis to help responders to Australia’s recent floods create relevance and context from social media reporting. A screenshot of the Australian flood trends map is embedded below:
This web app shows how crowdsourced social intelligence provided by Ushahidi enables emergency social data to be integrated into crisis response in a meaningful way.
The combination of Ushahidi and ESRI in Australia shows that “formal and innovative approaches to information collection and analysis during disasters is possible,” said Patrick Meier, “and that there is an interface that can be crafted between official and non-official responses.” Meier is a research fellow at the Harvard Humanitarian Initiative and director of crisis mapping at Ushahidi and was reached via email.
The Australian flooding web app includes the ability to toggle layers from OpenStreetMap, satellite imagery, topography, and filter by time or report type. By adding structured social data, the web app provides geospatial information system (GIS) operators with valuable situational awareness that goes beyond standard reporting, including the locations of property damage, roads affected, hazards, evacuations and power outages.
Russ Johnson, ESRI’s global director for emergency response, recently spoke with me at the ESRI federal user conference in Washington, D.C. Johnson spent 32 years as a federal employee in southern California, predominantly working in the U.S. Forest Service. He was one of the pioneers who built up the FEMA incident response system, and he commanded one of the 18 teams around the nation that deploy assets in the wake of floods, fires and other disasters. At ESRI, Johnson helps the company understand the workflow and relevance of GIS for first-response operations.
Our full interview is contained in the following video. Excerpts are noted below.
What happened in Australia with ESRI and Ushahidi?
“This was the first time that a major media group used Ushahidi and its media reach to crowdsource reports from the disaster affected population,” said Meier. “The combination of crowdsourced reporting with official reporting is noteworthy. And the fact that all of Ushahidi’s services were used simultaneously in Queensland is a first.”
Johnson hailed Ushahidi for its value as a platform for creating more “boundaried data” from the crisis data circulated around a given event. When better filters have been applied to social data, tagging or filtering, there’s an opportunity to add it to GIS. “The web app allows the user to start toggling on social media of a specific variety and then turn on GIS to add hotspotting information,” said Johnson. “Based upon that filter, which can be added to the validity of certain information, you can start to see needed resources.”
It’s similar to leading edge experiments with putting loosely bounded social data into structured forms to make it more actionable, said Johnson. “It makes it all more trustworthy — or at least your confidence is higher. We’re all trying to figure out how to take this gift and use it to become more effective and intelligent. The area I work in — mapping and geography — immediately provides context. If we can refine that context, it can lead us to other capabilities. If we know where other responders are located, can we direct closest available resource to the highest need problems.”

