
In this final post, (Posts 1-4 are found here), I will provide a summary of the first four posts, provide some insight into a view of top Authors, and include some data on electronic books and how parts of the digital world are surpassing the print world.
Report sections
Here is a quick summary of Posts 1-4.
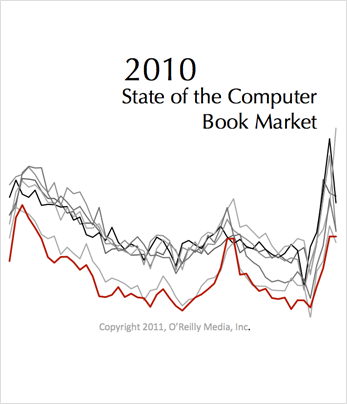
In 2010 the book market, as a whole, was about -4.54% lower in units sales than in 2009. The tech book market was off by -6.46% in 2010, so it suffered a little more than other sectors of the industry. However, that was an improvement from the -13.05% decline the tech publishers suffered in 2009. The market continued to follow its seasonal pattern, getting off to a fast start in 2010, taking its typical nose-dive downward in July, and recovering in the fall. There were 268 more titles (from all copyright years) that made it into the Top 3000 reports during 2010, and 260 more in 2009 than 2008. This is about 3.5% more titles per year. The average units per title declined from 39.64 in 2009 to 37.92 in 2010. There were 104 fewer titles published in 2010 that made the dataset, but they averaged 6 more units per title. Again, these titles had a publish date during 2010.
Mobile is one of the main driving forces in the market. Android Programming and Android devices (for users) both had tremendous growth, and iOS and Objective-C continued to expand market share. Windows 7 is another strong influence, climbing to the market-share levels that Windows XP used to occupy but that Vista never attained. Tablets came from virtually nowhere to become a hot category at the end of 2010. I would imagine the Tablet category will continue its rapid growth, as there is an abundance of Android tablets on the near-term horizon. On the other hand, Web Page Creation, Web Design Tools, and Web Programming have all had significant declines. MacOS experienced its first decline in years as Snow Leopard did not reach the levels of previous OS releases. Both Flash and Silverlight also had significant declines, as HTML5 is poised to offer similar functionality and may already be causing their market popularity to wane.
From a publisher’s perspective, O’Reilly moved into the second spot at the end of 2010, behind Wiley and slightly ahead of Pearson. The two imprints of O’Reilly and Dummies continue to have the most diverse publishing programs due to their strong performance in all six tech categories.
The number one title, from a dollar perspective, was PMP Exam Prep, Sixth Edition: Rita’s Course in a Book for Passing the PMP Exam and from a unit perspective, Windows 7 For Dummies. The number one programming language both 2009 and 2010 was Java, with JavaScript and VBA also showing strong growth in 2010. That’s the quick review.
Now let’s turn our attention to the most important ingredient in publishing — Authors. Authors are the entities that create all types of content. And there are all types of authors. Some are really like small publishing houses with “co-authors” doing most of the heavy lifting. Then there are those who do all the lifting, editing, writing, testing, and coding of the content themselves, and then move on to help promote, market and sell. These latter activities are what contribute to what we call an Author Platform. Some authors have an inherent platform by who they are or what their 9-5 job is, while others have to work hard to cultivate their platform. The most successful authors in our dataset, have figured out both the upfront creation of content, and the end-game of helping with marketing and sales. When you look at the data for the top 15 authors (basically, who has produced more units and dollars), you get the following two charts, showing lifetime sales (2004-2010).
| Units | Dollars |
|---|---|
 |
 |
In 2010, Paul McFedries had his name on 58 different books (ranging from 2001 through 2010) that made our list, for a total of 112,152 units sold. His books sold the most units in 2010 and he had 12 new books publish in 2010, that made the list. His total was about 20,000 more units than David Pogue who saw 13 of his titles make the list with 92,000 units sold. Although Pogue averaged about 7,000 units per title, and McFedries averaged about 1,900 per title. The remaining authors that make up the the top five authors for unit sales are: Andy Rathbone, Greg Harvey, and Dan Gookin. And if you look at the top five authors from a dollars perspective the list, in descending order looks like this: Paul McFedries, David Pogue, Andy Rathbone, Rita Mulcahy, and Scott Kelby.
Electronic distribution and Sales
Now let’s move past print sales in 2010 — or at least partially away from traditional channels of distribution, to discuss e-distribution. The chart immediately below shows eBooks sales in 2008. The data from The Association of American Publishers (AAP) is found here. What amazes me is the growth in scale. The scale has grown nearly 10-fold from the top of the scale being $18 million in 2008, to the top of the scale being $120 million in 2010. And the timing is just now at a tipping point because of all the tablet devices being released. If the market continues on its current growth pattern, it will be a Billion dollar business in 2013.
Click on each image to view a larger version.
| Market in 2008 | Market in 2010 |
|---|---|
|
|
 |

The AAP has these caveats to explain the data:
- The data above represent United States revenues only.
- The data above represent only trade eBook sales via wholesale channels. Retail numbers may be as much as double the above figures due to industry wholesale discounts.
- The data above represent only data submitted from approx. 12 to 15 trade publishers.
- The data does not include library, educational or professional electronic sales.
- The numbers reflect the wholesale revenues of publishers.
- The definition used for reporting electronic book sales is “All books delivered electronically over the Internet OR to hand-held reading devices”.
- The IDPF and AAP began collecting data together starting in Q1 2006.
Based on these caveats, it is an understatement, in my opinion, to say that the market will be a billion dollar market in 2013.
The following two charts show Safari revenue growth and the oreilly.com direct sales mix. The reason I am showing these is because the same content that goes into our print books is available in various digital forms. Safari is a subscription service with more than half a million users. Its main focus is its B2B service, allowing developers from many of the largest companies in the world to have access to Safari Books Online. One notable difference is that the categories with consumer-oriented titles and many of our Digital Media titles, do not perform as well in Safari. Developer titles rule in Safari. As you can see from the chart to the left, our content in Safari is growing at a nice steady rate.
The chart on the right is potentially more interesting and indicative of what is happening in the market. This shows the percentage of sales on oreilly.com during 2010 for Books, Ebooks, and Video. These are big three content types with much of the same content. The ebooks are just digital versions of our print products. So the big, and more likely HUGE, news is that ebooks represent about 88% of our unit sales, and 79% of our dollar sales on oreilly.com. What is really impressive is that the growth of our digital products is moving faster than the decline of our print products. This suggests to me that we are not seeing one product type cannibalizing another — rather they are supplementing each other. The third chart shows the changing nature of our publishing program. The percentages represent each particular format and how many units we sold that year. To me, this shows the trend of what is happening. Print is slowly declining, and EPUB, Mobi, and Ebooks are skyrocketing off the chart at a rate faster than print is declining. PDF is declining and when you think about it, this makes sense. O’Reilly used to offer two type of book product: print and a PDF. Now we offer our content in virtually any form a reader would like it. So with Mobi, EPUB, and Ebooks, we are seeing the less useful PDF decline significantly.
| Safari Growth for O’Reilly | oreilly.com Sales Mix |
 |
 |
|---|---|
| O’Reilly Product Sales Mix | |
 |
|
Again, this data is taken from direct sales for O’Reilly and oreilly.com, and may not represent the whole computer book market. I have heard from other publishers, specifically Dave Thomas at the Prags, that this split is consistent with, or a little behind, their publishing program. Smaller publishers who are growing are seeing digital products catch on quicker than print, and some of us who have sizeable legacy-print-programs are seeing a faster ramp-up of digital products than the decline of our print programs. It is an interesting notion to talk about a print program as ‘legacy’, but that is truly the best description. How’s that for the changing nature of the computer book market?
Thank you for reading these posts. If there is something that you are itching to see [understand more clearly], please let me know and I will try to help. I plan to excerpt updated pieces of these posts on Twitter throughout the year. They’ll come from @mikehatora and will likely get retweeted by @oreillymedia.