
My ongoing series about the elmcity project has shown a number of ways in which I invite participants to think like the web. One of the principles I try to illustrate by example is:
3. Know the difference between structured and unstructured data
Participants learn that calendars on web pages and in PDF files don’t syndicate around the web, but calendars in the structured iCalendar format do. They also learn a subtler lesson about structured data. Curators of elmcity hubs manage the settings for their hubs, and for their feeds, by tagging Delicious bookmarks using a name=value syntax that enables those bookmarks to work as associative arrays (also known as dictionaries, hashtables, and mappings). For example, here’s a picture of the bookmark that defines the settings for the Honolulu hub:
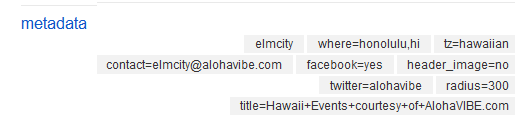
The bookmark’s tags represent these attributes:
contact: elmcity@alohavibe.com
facebook: yes
header_image: no
radius: 300
title: Hawaii Events courtesy of AlohaVIBE.com
twitter: alohavibe
tz: hawaiian
where: honolulu,hi
Curators use Delicious to declare these sets of attributes, but the elmcity service doesn’t always retrieve them from Delicious. Instead it syncs the data to Azure tables and blobs. When it needs to use one of these associative arrays it fetches an XML chunk from an Azure table or a JSON blob from the Azure blob store. Both arguably qualify as NoSQL mechanisms but I prefer to define things according to what they are instead of what they’re not. To me these are just ways to store and retrieve associative arrays.
Visualizing change history for elmcity metadata
Recently I’ve added a feature that enables curators to review the changes they’ve made to the metadata for their hubs and feeds. The other day, for example, I made two changes to the Keene hub’s registry. I added a new feed, and I added a tag to an existing feed. You can see both changes highlighted in green on this change history page. A few hours later I renamed the tag I’d added. That change shows up in yellow here. On the following day I deleted three obsolete feeds. That change shows up in yellow here and in red here.
These look a lot like Wikipedia change histories, or the “diffs” that programmers use to compare versions of source files. But Wikipedia histories and version control diffs compare unstructured texts. When you change structured data you can, at least in theory, visualize your changes in more focused ways.
One of the great ironies of software development is that although computer programs are highly structured texts, we treat them just like Wikipedia articles when we compare versions. I’ve had many discussions about this over the years with my friend Greg Wilson, proprietor of the Software Carpentry project. We’ve always hoped that mainstream version control systems would become aware of the structure of computer programs. So far we’ve been disappointed, and I guess I can understand why. Old habits run deep. I am, after all, writing these words in a text editor that emulates emacs.
 Strata Conference New York 2011, being held Sept. 22-23, covers the latest and best tools and technologies for data science — from gathering, cleaning, analyzing, and storing data to communicating data intelligence effectively.
Maybe, though, we can make a fresh start as the web of data emerges. The lingua franca of the data web was going to be XML, now the torch has passed to JSON (JavaScript Object Notation), both are used widely to represent all kinds of data structures whose changes we might want to visualize in structured ways.
The component at the heart of the elmcity’s new change visualizer is a sweet little all-in-one-page web app by Tom Robinson. It’s called JSON Diff. To try it out in a simple way, let’s use this JSON construct:
{
  "Evernote" :
   {
   "InstalledOn":"3/19/2008",
   "Version": "3.0.0.539"
   },
  "Ghostery IE Plugin" :
   {
   "InstalledOn":"7/9/2011",
   "Version": "2.5.2.0"
   }
}
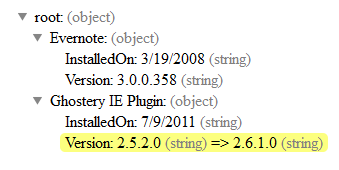 These are a couple of entries from the Programs and Features applet in my Windows Control Panel. If my system were taking JSON snapshots of those entries whenever they changed, and if I were later to upgrade the Ghostery plugin to (fictitious future version) 2.6.1.0, I could see this JSON Diff report:
You can try it yourself at this JSON Diff URL. Or if you’re running Internet Explorer, which the original JSON Diff doesn’t support, you can copy that JSON chunk and paste it into one of the earlier examples. The elmcity adaptation of JSON Diff, which uses JQuery to abstract browser differences, does work with IE.
It’s worth noting that the original JSON Diff has the remarkable ability to remember any changes you make by dynamically tweaking its URL. It does so by tacking your JSON fragments onto the end of the URL after the hash symbol (#) as one long fragment identifier! The elmcity version sacrifices that feature in order to avoid running into browser-specific URL-length limits, and because it works with a server-side companion that can feed it data. But it’s cool to see how a self-contained single-page web app can deliver what is, in effect, a web service.
What changed, and when?
A key question, in many contexts, is: “What changed, and when?” In the Heavy Metal Umlaut screencast I animated the version history of a Wikipedia page. It was a fascinating exercise that sparked ideas about tools that would automate the process. Those tools haven’t arrived yet. We could really use them, and not just for Wikipedia. In law and in journalism the version control discipline practiced by many (but not all!) programmers is tragically unknown. In these and in other fields we should expect at least what Wikipedia provides — and ideally better ways to visualize textual change histories.
But we can also expect more. Think about the records that describe the status of your health, finances, insurance policies, vehicles, and computers. Or the products and personnel of companies you work for or transact with. Or the policies of governments you elect. All these records can be summarized by key status indicators that are conceptually just sets of name/value pairs. If the systems that manage these records could produce timestamped JSON snapshots when indicators change, it would be much easier to find out what changed, and when.
Related: