In this final post, (posts 1-4 are available here), I will provide a summary of the first four posts, provide some insight into a view of top authors, and include data on electronic books and how parts of the digital world are surpassing the print world.
Here is a quick summary of posts 1-4.
In 2011 the book market, as a whole, saw about -9.25% fewer units sold than in 2010. The tech book market was up by 2% in 2011, so it out performed the whole market. Yet our data, which is based on the Top 3000 titles for each week, shows only 0.7% growth. This means that the majority of the growth was generated by the titles that produced very few copies and may not have made it into a weekly report for a given week in 2011. The market continued to follow its seasonal pattern, getting off to a fast start in 2011, taking its typical nose-dive downward in July, and recovering in the fall. Yet there were some anomalies with higher peaks and valleys in the trend-lines for 2011. These anomalies were caused by Borders Books (BGI) going out of business.
There were 21 weeks in 2011 that were ahead of the same week in 2010. In 2010 there were only 11 weeks that were ahead of the prior year’s unit sales. There were 442 more titles (from all copyright years) that made it into the Top 3000 reports during 2011, and 268 more in 2010 than 2009. This demonstrates that the threshold to make a Top 3000 report was lower than any other year. The average units per title, for all titles not just new, increased slightly from 37.95 in 2010 to 37.96 in 2011. As far as new 2011 titles, there were 349 fewer titles published that made the dataset, but they averaged 3.4 more units per title and averaged 1 less page per title, and on average cost $0.80 less than 2010. Again, these titles had a publish date during 2011.
The biggest winners in growth order are: Tablet, Mobile Programming, Windows Consumer, Security Topics, Hardware Topics, Social Web, Computers and Society, Cloud Computing, Information Technology, and Data Topics. The areas with the largest drop in units were, in descending order: Web Page Creation, Digital Photography, Mac OS, Flash, Web Programming, Web Design Tools, Personal Computers, Linux, Software Project Management, and Personal Database. In the top performing area of Mobile Programming, iOS was nine times as large as Android in 2009, and roughly 2.5 times as large of a category in 2010, and today sells only 1.2 times as many copies of Android books to developers.
From a publisher’s perspective, Pearson regained the second spot at the end of 2011, behind Wiley and slightly ahead of O’Reilly. The two imprints of O’Reilly and Dummies continue to have the most diverse publishing programs due to their strong performance in all six tech categories.
The number one title, from a dollar perspective, was PMP Exam Prep, Sixth Edition: Rita’s Course in a Book for Passing the PMP Exam and from a unit perspective, My iPad 2. From a dollars perspective, the PMP book has ranked in the top two since 2005. The number one programming language for three years running (2009, 2010, and 2011) was Java, with JavaScript and VBA also showing continued strong growth in 2011. That’s the quick review.
Now let’s turn our attention to the most important ingredient in publishing — authors. Authors are the entities that create all types of content. And there are all types of authors. Some are really like small publishing houses with “co-authors” doing most of the heavy lifting. Then there are those who do all the lifting: editing, writing, testing, and coding of the content themselves, and then move on to help promote, market and sell. These latter activities are what contribute to what we call an author platform. Some authors have an inherent platform by who they are or what their 9-5 job is, while others have to work hard to cultivate their platform. The most successful authors in our dataset have figured out both the upfront creation of content and the end-game of helping with marketing and sales. The table below shows the top 15 authors for 2011 and what their rank is for both 2011 and lifetime units. I’m also showing what their % Units ’11 was so you can see the percentage of their lifetime units that they sold in 2011. A few did really well in 2011 and yet lifetime are not a top 10 author. Scott Kelby and David Pogue did not have outstanding numbers in 2011 but are the top two lifetime authors from a units perspective. Gary Rosenzweig and Patrick Kanouse both had outstanding sales in 2011 but are nowhere near top 15 authors from a lifetime perspective.
| Author_List | 2011 Rank | All Time Rank | % Units ’11 |
| Paul McFedries | 1 | 6 | 17.68% |
| Andy Rathbone | 2 | 3 | 9.18% |
| Gary Rosenzweig | 3 | 61 | 59.19% |
| Nancy C. Muir | 4 | 24 | 25.26% |
| David Pogue | 5 | 1 | 7.57% |
| Greg Harvey | 6 | 4 | 9.10% |
| Edward C. Baig, Bob LeVitus | 7 | 44 | 41.49% |
| Patrick Kanouse | 8 | 148 | 90.02% |
| Brad Miser | 9 | 30 | 28.52% |
| Dan Gookin | 10 | 5 | 7.75% |
| Stephen L. Nelson | 11 | 8 | 9.49% |
| John Walkenbach | 12 | 10 | 10.17% |
| Wallace Wang | 13 | 13 | 11.10% |
| Scott Kelby | 14 | 2 | 4.55% |
| Peter Weverka | 15 | 19 | 11.41% |
The noticeable change is that Scott Kelby takes the number one spot from a dollar perspective even though David Pogue sells more units. Books with slightly higher prices enable this movement in the position/rank. Notice that Rita Mulchay does not make the Top 15 for units sold, and yet as an author her books are ranked number seven in dollars generated. Another interesting observation is that there are about six authors that are in the mix for the top spot all-time, yet there is a significant drop-off after the top six. In the dollars view, the drop-off is even more significant after the top two authors.
When you look at the data for the top 15 authors (basically, who has produced more units and dollars), you get the following two charts, showing lifetime sales (2004-2011).
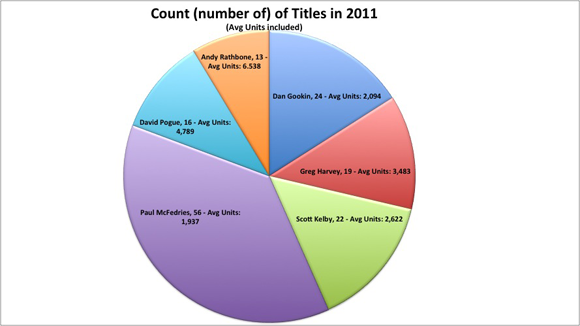
In 2011, Paul McFedries had his name on 56 different books (ranging from 2001 through 2011) that made our list, for an average of 1,937 units per book. His books sold the most units in 2011 but his average was the lowest of the all time top-five authors. His total was about 22,000 more units than David Pogue who saw 16 of his titles make the list with an average of 4,789 per title.
Electronic distribution and sales
Now let’s move past print sales in 2011 — or at least partially away from traditional channels of distribution — to discuss e-distribution. The three charts immediately below are from Bowker, which has recently released its Results Of Global eBook Research. The charts show three interesting graphs about awareness of for-pay content, digital consumption by gender, and digital consumption by age. What is interesting to me is not that Indian males lead the way in both digital downloads and purchasing for-pay content, but rather that more women than men in the U.S. and U.K. are consumers of digital content. It is also no surprise, at least to me, that the 25-34 age group is the most active in consuming digital content.
Click on each image to view a larger version.
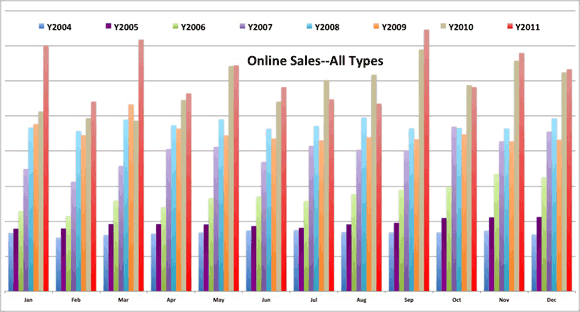
Now to take you into the tech book digital market, let’s look at what has happened in the past few years with O’Reilly products. The chart immediately below shows our digital products aggregated into one number and then plotted by year and month. This gives you a perspective of how things are changing. What it does not show is that early digital copies were all PDF files that were pretty clumsy and not as useful. Now we offer our content in virtually any form our readers prefer. So with Mobi and EPUB, we are seeing the less useful PDF decline significantly. But the chart below groups all digital forms together. Only two months in 2011 were not ahead of 2010. Those two months were June and July, which coincidentally coincided with the Borders’ liquidation of physical products.
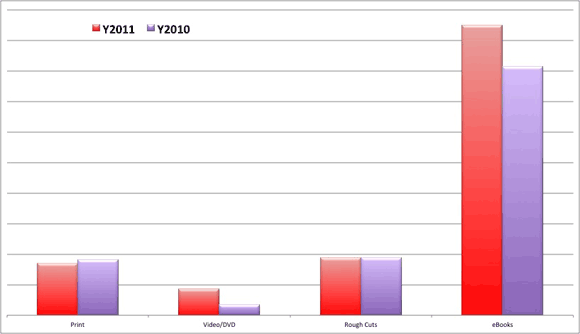
I also think it is important to look at what O’Reilly customers purchased when visiting oreilly.com. The chart below shows our content mix for the previous two years. The only thing declining in 2011 was our total sales for print products. Rough Cuts are early access editions of our content that are accessible on Safari. As you can see, our ebooks outsell everything by nearly 4 to 1.
What I am not sure exists is a good indicator of what the startup community uses for technical content and books. But if I had to bet, I would wager on ebooks direct from the publisher would be the preferred format in the startup world.
The four charts below show O’Reilly revenue and units growth through oreilly.com. The reason I am showing these is because the same content that goes into our print books is available in various digital forms. It is quite obvious that our customers prefer to shop on oreilly.com for digital copies.
The two charts on the left are showing revenue (top-left) and units (bottom-left) for 2011 exclusively. The two charts on the right are both revenue and units but are showing the trend for the previous four years. From talking with other publishers, this high-growth trend for digital books is indicative of what is happening in the market. The ebooks are just digital versions of our print products. We have not come to a point yet where the digital edition is a native creation that is a blend of live, editable code, video, text, images, links, assessment tools, and other resources all working together. At this point in time, most digital products are typically print books with a few links and some color for good measure. But don’t blink because the tech book market will change quickly to these more blended content types.
| O’Reilly Product Mix – Revenue 2011 | O’Reilly Print vs. eBook – Revenue Trend |
 |
 |
| O’Reilly Product Mix – Units 2011 | O’Reilly Print vs. eBook – Units Trend |
 |
 |
Again, this data is taken from direct sales for O’Reilly and oreilly.com, and may not represent the whole computer book market. One point that was recently brought in discussions at O’Reilly by our VP of online is that O’Reilly is selling more copies of digital editions than any other distributors that carry our digital copies. I think that may be due to the fact that we have DRM-free content that allows you to move your copy of your purchase to another device. For another perspective on DRM, I wrote this for our author newsletter a while back and I still believe that the ideas are sound. Have a look here.
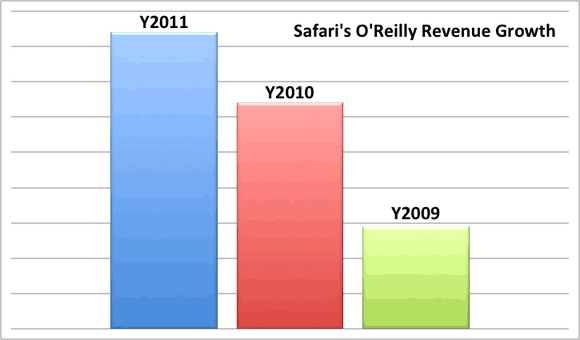
Another key ingredient to understanding what is happening in the digital world is to look at Safari Books Online. Safari is a subscription service with more than 500,000 users. Its main focus is its B2B service that allows developers from many of the largest companies in the world to have access to technical books from most of the major publishing houses and imprints. One notable difference is that the categories with consumer-oriented titles, including the Digital Media titles, do not perform as well in Safari. Developer titles rule in Safari; so as a proxy, Safari may be one of the better predictors of a tech book market. As you can see from the chart to the left, our content in Safari is growing at a nice steady rate. In fact it is safe to say that Safari represents the second largest distribution channel for O’Reilly, with Amazon still occupying the top spot and O’Reilly direct battling for third. It will be interesting to see how the distribution of technical content unfolds in the coming years.
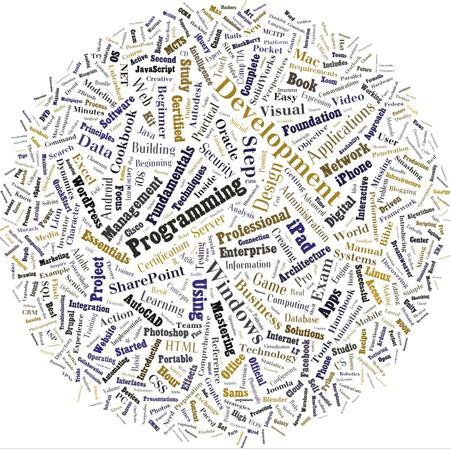
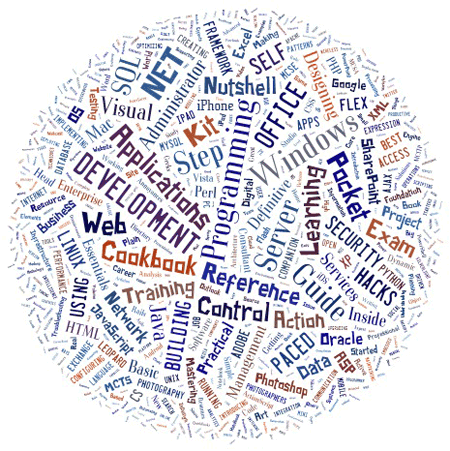
If you look at word clouds for the titles published in 2011 for all books, and the ones found on Safari for O’Reilly during 2011, you notice some similarities. Notably that “Development” and “Programming” are big in both images, but slightly larger on Safari. I was initially not sure why “Control” was so large on Safari, but after a bit of digging I found that Tidbits Publishing has a series called “Take Control” and O’Reilly Media is a distribution partner for them in Safari.
Thank you for reading these posts. If there is something that you are itching to see / understand more clearly, please let me know and I will try to help. I plan to excerpt updated pieces of these posts on Twitter or Google+ throughout the year. They’ll come from @mikehatora or +Mike Hendrickson and will likely get re-tweeted by @oreillymedia or +O’Reilly on Google+.
 State of the Computer Book Market 2011 — All five parts of Mike Hendrickson’s computer book market report are collected in this free ebook. Available in EPUB, Mobi and PDF formats.


