
Having worked in academia, government and industry, I’ve had a unique opportunity to build products in each sector. Much of this product development has been around building data products. Just as methods for general product development have steadily improved, so have the ideas for developing data products. Thanks to large investments in the general area of data science, many major innovations (e.g., Hadoop, Voldemort, Cassandra, HBase, Pig, Hive, etc.) have made data products easier to build. Nonetheless, data products are unique in that they are often extremely difficult, and seemingly intractable for small teams with limited funds. Yet, they get solved every day.
How? Are the people who solve them superhuman data scientists who can come up with better ideas in five minutes than most people can in a lifetime? Are they magicians of applied math who can cobble together millions of lines of code for high-performance machine learning in a few hours? No. Many of them are incredibly smart, but meeting big problems head-on usually isn’t the winning approach. There’s a method to solving data problems that avoids the big, heavyweight solution, and instead, concentrates building something quickly and iterating. Smart data scientists don’t just solve big, hard problems; they also have an instinct for making big problems small.
We call this Data Jujitsu: the art of using multiple data elements in clever ways to solve iterative problems that, when combined, solve a data problem that might otherwise be intractable. It’s related to Wikipedia’s definition of the ancient martial art of jujitsu: “the art or technique of manipulating the opponent’s force against himself rather than confronting it with one’s own force.”
How do we apply this idea to data? What is a data problem’s “weight,” and how do we use that weight against itself? These are the questions that we’ll work through in the subsequent sections.

To start, for me, a good definition of a data product is a product that facilitates an end goal through the use of data. It’s tempting to think of a data product purely as a data problem. After all, there’s nothing more fun than throwing a lot of technical expertise and fancy algorithmic work at a difficult problem. That’s what we’ve been trained to do; it’s why we got into this game in the first place. But in my experience, meeting the problem head-on is a recipe for disaster. Building a great data product is extremely challenging, and the problem will always become more complex, perhaps intractable, as you try to solve it.
Before investing in a big effort, you need to answer one simple question: Does anyone want or need your product? If no one wants the product, all the analytical work you throw at it will be wasted. So, start with something simple that lets you determine whether there are any customers. To do that, you’ll have to take some clever shortcuts to get your product off the ground. Sometimes, these shortcuts will survive into the finished version because they represent some fundamentally good ideas that you might not have seen otherwise; sometimes, they’ll be replaced by more complex analytic techniques. In any case, the fundamental idea is that you shouldn’t solve the whole problem at once. Solve a simple piece that shows you whether there’s an interest. It doesn’t have to be a great solution; it just has to be good enough to let you know whether it’s worth going further (e.g., a minimum viable product).
Here’s a trivial example. What if you want to collect a user’s address? You might consider a free-form text box, but writing a parser that can identify a name, street number, apartment number, city, zip code, etc., is a challenging problem due to the complexity of the edge cases. Users don’t necessarily put in separators like commas, nor do they necessarily spell states and cities correctly. The problem becomes much simpler if you do what most web applications do: provide separate text areas for each field, and make states drop-down boxes. The problem becomes even simpler if you can populate the city and state from a zip code (or equivalent).
Now for a less trivial example. A LinkedIn profile includes a tremendous amount of information. Can we use a profile like this to build a recommendation system for conferences? The answer is “yes.” But before answering “how,” it’s important to step back and ask some fundamental questions:
A) Does the customer care? Is there a market fit? If there isn’t, there’s no sense in building an application.
B) How long do we have to learn the answer to Question A?
We could start by creating and testing a full-fledged recommendation engine. This would require an information extraction system, an information retrieval system, a model training layer, a front end with a well-designed user interface, and so on. It might take well over 1,000 hours of work before we find out whether the user even cares.
Instead, we could build a much simpler system. Among other things, the LinkedIn profile lists books.
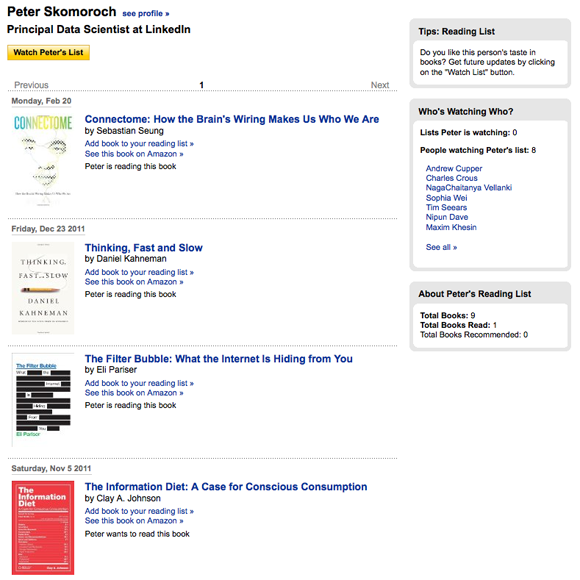
Books have ISBN numbers, and ISBN numbers are tagged with keywords. Similarly, there are catalogs of events that are also cataloged with keywords (Lanyrd is one). We can do some quick and dirty matching between keywords, build a simple user interface, and deploy it in an ad slot to a limited group of highly engaged users. The result isn’t the best recommendation system imaginable, but it’s good enough to get a sense of whether the users care. Most importantly, it can be built quickly (e.g., in a few days, if not a few hours). At this point, the product is far from finished. But now you have something you can test to find out whether customers are interested. If so, you can then gear up for the bigger effort. You can build a more interactive user interface, add features, integrate new data in real time, and improve the quality of the recommendation engine. You can use other parts of the profile (skills, groups and associations, even recent tweets) as part of a complex AI or machine learning engine to generate recommendations.
The key is to start simple and stay simple for as long as possible. Ideas for data products tend to start simple and become complex; if they start complex, they become impossible. But starting simple isn’t always easy. How do you solve individual parts of a much larger problem? Over time, you’ll develop a repertoire of tools that work for you. Here are some ideas to get you started.
Use product design
One of the biggest challenges of working with data is getting the data in a useful form. It’s easy to overlook the task of cleaning the data and jump to trying to build the product, but you’ll fail if getting the data into a usable form isn’t the first priority. For example, let’s say you have a simple text field into which the user types a previous employer. How many ways are there to type “IBM”? A few dozen? In fact, thousands: everything from “IBM” and “I.B.M.” to “T.J. Watson Labs” and “Netezza.” Let’s assume that to build our data product it’s necessary to have all these names tied to a common ID. One common approach to disambiguate the results would be to build a relatively complex artificial intelligence engine, but this would take significant time. Another approach would be to have a drop-down list of all the companies, but this would be a horrible user experience due to the length of the list and limited flexibility in choices.
What about Data Jujitsu? Is there a much simpler and more reliable solution? Yes, but not in artificial intelligence. It’s not hard to build a user interface that helps the user arrive at a clean answer. For example, you can:
- Support type-ahead, encouraging the user to select the most popular term.
- Prompt the user with “did you mean … ?”
- If at this point you still don’t have anything usable, ask the user for more help: Ask for a stock ticker symbol or the URL of the company’s home page.
The point is to have a conversation rather than just a form. Engage the user to help you, rather than relying on analysis. You’re not just getting the user more involved (which is good in itself), you’re getting clean data that will simplify the work for your back-end systems. As a matter of practice, I’ve found that trying to solve a problem on the back end is 100-1,000 times more expensive than on the front end.
When in doubt, use humans
As technologists, we are predisposed to look for scalable technical solutions. We often jump to technical solutions before we know what solutions will work. Instead, see if you can break down the task into bite-size portions that humans can do, then figure out a technical solution that allows the process to scale. Amazon’s Mechanical Turk is a system for posting small problems online and paying people a small amount (typically a couple of cents) for solutions. It’s come to the rescue of many an entrepreneur who needed to get a product off the ground quickly but didn’t have months to spend on developing an analytical solution.
Here’s an example. A camera company wanted to test a product that would tell restaurant owners how many tables were occupied or empty during the day. If you treat this problem as an exercise in computer vision, it’s very complex. It can be solved, but it will take some PhDs, lots of time, and large amounts of computing power. But there’s a simpler solution. Humans can easily look at a picture and tell whether or not a table has anyone seated at it. So the company took images at regular intervals and used humans to count occupied tables. This gave them the opportunity to test their idea and determine whether the product was viable before investing in a solution to a very difficult problem. It also gave them the ability to find out what their customers really wanted to know: just the number of occupied tables? The average number of people at each table? How long customers stayed at the table? That way, when they start to build the real product, using computer vision techniques rather than humans, they know what problem to solve.
Humans are also useful for separating valid input from invalid. Imagine building a system to collect recipes for an online cookbook. You know you’ll get a fair amount of spam; how do you separate out the legitimate recipes? Again, this is a difficult problem for artificial intelligence without substantial investment, but a fairly simple problem for humans. When getting started, we can send each page to three people via Mechanical Turk. If all agree that the recipe is legitimate, we can use it. If all agree that the recipe is spam, we can reject it. And if the vote is split, we can escalate by trying another set of reviewers or adding additional data to those additional reviewers that allows them to make a better assessment. The key thing is to watch for the signals the humans use to make their decisions. When we’ve identified those signals, we can start building more complex automated systems. By using humans to solve the problem initially, we can learn a great deal about the problem at a very low cost.
Aardvark (a promising startup that was acquired by Google) took a similar path. Their goal was to build a question and answer service that routed users’ questions to real people with “inside knowledge.” For example, if a user wanted to know a good restaurant for a first date in Palo Alto, Calif., Aardvark would route the question to people living in the broader Palo Alto area, then compile the answers. They started by building tools that would allow employees to route the questions by hand. They knew this wouldn’t scale, but it let them learn enough about the routing problem to start building a more automated solution. The human solution not only made it clear what they needed to build, it proved that the technical solution was worth the effort and bought them the time they needed to build it.
In both cases, if you were to graph the work expended versus time, it would look something like this:
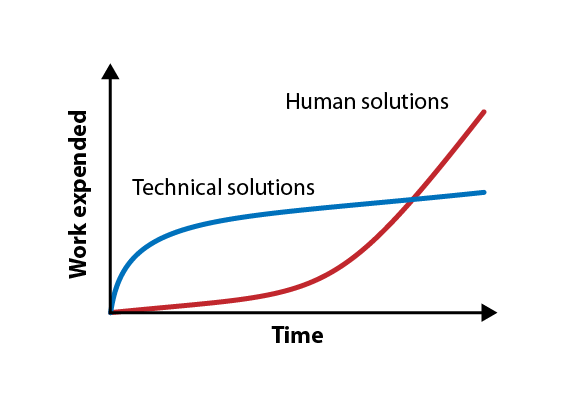
Ignore the fact that I’ve violated a fundamental law of data science and presented a graph without scales on the axes. The point is that technical solutions will always win in the long run; they’ll always be more efficient, and even a poor technical solution is likely to scale better than using humans to answer questions. But when you’re getting started, you don’t care about the long run. You just want to survive long enough to have a long run, to prove that your product has value. And in the short term, human solutions require much less work. Worry about scaling when you need to.
Be opportunistic for wins
I’ve stressed building the simplest possible thing, even if you need to take shortcuts that appear to be extreme. Once you’ve got something working and you’ve proven that users want it, the next step is to improve the product. Amazon provides a good example. Back when they started, Amazon pages contained product details, reviews, the price, and a button to buy the item. But what if the customer isn’t sure he’s found what he wants and wants to do some comparison shopping? That’s simple enough in the real world, but in the early days of Amazon, the only alternative was to go back to the search engine. This is a “dead end flow”: Once the user has gone back to the search box, or to Google, there’s a good chance that he’s lost. He might find the book he wants at a competitor, even if Amazon sells the same product at a better price.
Amazon needed to build pages that channeled users into other related products; they needed to direct users to similar pages so that they wouldn’t lose the customer who didn’t buy the first thing he saw. They could have built a complex recommendation system, but opted for a far simpler system. They did this by building collaborative filters to add “People who viewed this product also viewed” to their pages. This addition had a profound effect: Users can do product research without leaving the site. If you don’t see what you want at first, Amazon channels you into another page. It was so successful that Amazon has developed many variants, including “People who bought this also bought” (so you can load up on accessories), and so on.
The collaborative filter is a great example of starting with a simple product that becomes a more complex system later, once you know that it works. As you begin to scale the collaborative filter, you have to track the data for all purchases correctly, build the data stores to hold that data, build a processing layer, develop the processes to update the data, and deal with relevancy issues. Relevance can be tricky. When there’s little data, it’s easy for a collaborative filter to give strange results; with a few errant clicks in the database, it’s easy to get from fashion accessories to power tools. At the same time, there are still ways to make the problem simpler. It’s possible to do the data analysis in a batch mode, reducing the time pressure; rather than compute “People who viewed this also viewed” on the fly, you can compute it nightly (or even weekly or monthly). You can make do with the occasional irrelevant answer (“People who bought leather handbags also bought power screwdrivers”), or perhaps even use Mechanical Turk to filter your pre-computed recommendations. Or even better, ask the users for help.
Being opportunistic can be done with analysis of general products, too. The Wall Street Journal chronicles a case in which Zynga was able to rapidly build on a success in their game FishVille. You can earn credits to buy fish, but you can also purchase credits. The Zynga Analytics team noticed that a particular set of fish was being purchased at six times the rate of all the other fish. Zynga took the opportunity to design several similar virtual fish, for which they charged $3 to $4 each. The data showed that they clearly had stumbled on to something. The common trait was that the translucent feature of the fish was what the customer wanted. Using this combination of quick observations and deploying lightweight tests, they were able to significantly add to their profits.
Ground your product in the real world
We can learn more from Amazon’s collaborative filters. What happens when you go into a physical store to buy something, say, headphones? You might look for sale prices, you might look for reviews, but you almost certainly don’t just look at one product. You look at a few, most likely something located near whatever first caught your eye. By adding “People who viewed this product also viewed,” Amazon built a similar experience into the web page. In essence, they “grounded” their virtual experience to a similar one in the real world via data.
LinkedIn’s People You May Know embodies both Data Jujitsu and grounding the product in the real world. Think about what happens when you arrive at a conference reception. You walk around the outer edge until you find someone you recognize, then you latch on to that person until you see some more people you know. At that point, your interaction style changes: Once you know there are friendly faces around, you’re free to engage with people you don’t know. (It’s a great exercise to watch this happen the next time you attend a conference.)
The same kind of experience takes place when you join a new social network. The first data scientists at LinkedIn recognized this and realized that their online world had two big challenges. First, because it is a website, you can’t passively walk around the outer edges of the group. It’s like looking for friends in a darkened room. Second, LinkedIn is fighting for every second you stay on its site; it’s not like a conference where you’re likely to have a drink or two while looking for friends. There’s a short window, really only a few seconds, for you to become engaged. If you don’t see any point to the site, you click somewhere else and you’re gone.
Earlier attempts to solve this problem, such as address book importers or search facilities, imposed too much friction. They required too much work for the poor user, who still didn’t understand why the site was valuable. But our LinkedIn team realized that a few simple heuristics could be used to determine a set of “people you may know.” We didn’t have the resources to build a complete solution. But to get something started, we could run a series of simple queries on the database: “what do you do,” “where do you live,” “where did you go to school,” and other questions that you might ask someone you met for the first time. We also used triangle closing (if Jane is connected to Mark, and Mark is connected to Sally, Sally and Jane have a high likelihood of knowing each other). To test the idea, we built a customized ad that showed each user the three people they were most likely to know. Clicking on one of those people took you to the “add connection” page. (Of course, if you saw the ad again, the results would have been the same, but the point was to quickly test with minimal impact to the user.) The results were overwhelming; it was clear that this needed to become a full-blown product, and it was quickly replicated by Facebook and all other social networks. Only after realizing that we had a hit on our hands did we do the work required to build the sophisticated machinery necessary to scale the results.
After People You May Know, our LinkedIn team realized that we could use a similar approach to build Groups You May Like. We built it almost as an exercise, when we were familiarizing ourselves with some new database technologies. It took under a week to build the first version and get it on to the home page, again using an ad slot. In the process, we learned a lot about the limitations and power of a recommendation system. On one hand, the numbers showed that people really loved the product. But additional filter rules were needed: Users didn’t like it when the system recommended political or religious groups. In hindsight, this seems obvious, almost funny, but it would have been very hard to anticipate all the rules we needed in advance. This lightweight testing gave us the flexibility to add rules as we discovered we needed them. Since we needed to test our new databases anyway, we essentially got this product “for free.” It’s another great example of a group that did something successful, then immediately took advantage of the opportunities for further wins.
Give data back to the user to create additional value
By giving data back to the user, you can create both engagement and revenue. We’re far enough into the data game that most users have realized that they’re not the customer, they’re the product. Their role in the system is to generate data, either to assist in ad targeting or to be sold to the highest bidder, or both. They may accept that, but I don’t know anyone who’s happy about it. But giving data back to the user is a way of showing that you’re on their side, increasing their engagement with your product.
How do you give data back to the user? LinkedIn has a product called “Who’s Viewed Your Profile.” This product lists the people who have viewed your profile (respecting their privacy settings, of course), and provides statistics about the viewers. There’s a time series view, a list of search terms that have been used to find you, and the geographical areas in which the viewers are located. It’s timely and actionable data, and it’s addictive. It’s visible on everyone’s home page, and it shows the number of profile views, so it’s not static. Every time you look at your LinkedIn page, you’re tempted to click.

And people do click. Engagement is so high that LinkedIn has two versions: one free, and the other part of the subscription package. This product differentiation benefits the casual user, who can see some summary statistics without being overloaded with more sophisticated features, while providing an easy upgrade path for more serious users.
LinkedIn isn’t the only product that provides data back to the user. Xobni analyzes your email to provide better contact management and help you control your inbox. Mint (acquired by Intuit) studies your credit cards to help you understand your expenses and compare them to others in your demographic. Pacific Gas and Electric has a SmartMeter that allows you to analyze your energy usage. We’re even seeing health apps that take data from your phone and other sensors and turn it into a personal dashboard.
In short, everyone reading this has probably spent the last year or more of their professional life immersed in data. But it’s not just us. Everyone, including users, has awakened to the value of data. Don’t hoard it; give it back, and you’ll create an experience that is more engaging and more profitable for both you and your company.
No data vomit
As data scientists, we prefer to interact with the raw data. We know how to import it, transform it, mash it up with other data sources, and visualize it. Most of your customers can’t do that. One of the biggest challenges of developing a data product is figuring out how to give data back to the user. Giving back too much data in a way that’s overwhelming and paralyzing is “data vomit.” It’s natural to build the product that you would want, but it’s very easy to overestimate the abilities of your users. The product you want may not be the product they want.
When we were building the prototype for “Who’s Viewed My Profile,” we created an early version that showed all sorts of amazing data, with a fantastic ability to drill down into the detail. How many clicks did we get when we tested it? Zero. Why? An “inverse interaction law” applies to most users: The more data you present, the less interaction.
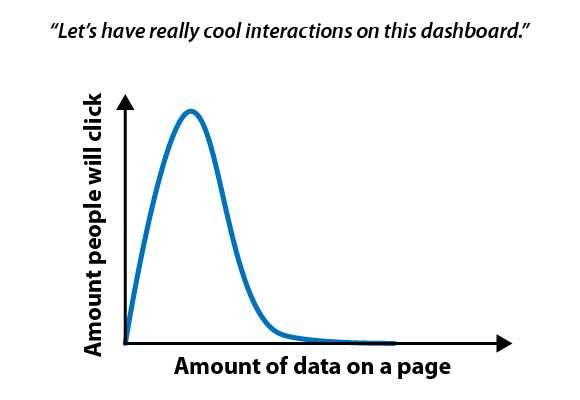
The best way to avoid data vomit is to focus on actionability of data. That is, what action do you want the user to take? If you want them to be impressed with the number of things that you can do with the data, then you’re likely producing data vomit. If you’re able to lead them to a clear set of actions, then you’ve built a product with a clear focus.
Expect unforeseen side effects
Of course, it’s impossible to avoid unforeseen side effects completely, right? That’s what “unforeseen” means. However, unforeseen side effects aren’t a joke. One of the best examples of an unforeseen side effect is “My TiVo Thinks I’m Gay.” Most digital video recorders have a recommendation system for other shows you might want to watch; they’ve learned from Amazon. But there are cases wherein a user has watched a particular show (say “Will & Grace”), and then it recommends other shows with similar themes (“The Ellen DeGeneres Show,” “Queer as Folk,” etc.). Along similar lines, An Anglo friend of mine who lives in a neighborhood with many people from Southeast Asia recently told me that his Netflix recommendations are overwhelmed with Bollywood films.
This sounds funny, and it’s even been used as the basis of a sitcom plot. But it’s a real pain point for users. Outsmarting the recommendation engine once it has “decided” what you want is difficult and frustrating, and you stand a good chance of losing the customer. What’s going wrong? In the case of the Bollywood recommendations, the algorithm is probably overemphasizing the movies that have been watched by the surrounding population. With the TiVo, there’s no easy way to tell the system that it’s wrong. Instead, you’re forced to try to outfox it, and users who have tried have discovered that it’s hard to out think an intelligent agent that has gotten the wrong idea.
Improving precision and recall
What tools do we have to think about bad results — things like unfortunate recommendations and collaborative filtering gone wrong? Two concepts, precision and recall, let us describe the problem more precisely. Here’s what they mean:
Precision — The ability to provide a result that exactly matches what’s desired. If you’re building a recommendation engine, can you give a good recommendation every time? If you’re displaying advertisements, will every ad result in a click? That’s high precision.
Recall — The set of possible good recommendations. Recall is fundamentally about inventory: Good recall means that you have a lot of good recommendations, or a lot of advertisements that you can potentially show the user.
It’s obvious that you’d like to have both high precision and high recall. For example, if you’re showing a user advertisements, you’d be in heaven if you have a lot of ads to show, and every ad has a high probability of resulting in a click. Unfortunately, precision and recall often work against each other: As precision increases, recall drops, and vice versa. The number of ads that have a 95% chance of resulting in a click is likely to be small indeed, and the number of ads with a 1% chance is obviously much larger.
So, an important issue in product design is the tradeoff between precision versus recall. If you’re working on a search engine, precision is the key, and having a large inventory of plausible search results is irrelevant. Results that will satisfy the user need to get to the top of the page. Low-precision search results yield a poor experience.
On the other hand, low-precision ads are almost harmless (perhaps because they’re low precision, but that’s another matter). It’s hard to know what advertisement will elicit a click, and generally it’s better to show a user something than nothing at all. We’ve seen enough irrelevant ads that we’ve learned to tune them out effectively.
The difference between these two cases is how the data is presented to the user. Search data is presented directly: If you search Google for “data science,” you’ll get 1.16 billion results in 0.47 seconds (as of this writing). The results on the first few pages will all have the term “data science” in them. You’re getting results directly related to your search; this makes intuitive sense. But the rationale behind advertising content is obfuscated. You see ads, but you don’t know why you were shown those ads. Nothing says, “We showed you this ad because you searched for data science and we know you live in Virginia, so here’s the nearest warehouse for all your data needs.” Since the relationship between the ad and your interests is obfuscated, it’s hard to judge an ad harshly for being irrelevant, but it’s also not something you’re going to pay attention to.
Generalizing beyond advertising, when building any data product in which the data is obfuscated (where there isn’t a clear relationship between the user and the result), you can compromise on precision, but not on recall. But when the data is exposed, focus on high precision.
Subjectivity
Another issue to contend with is subjectivity: How does the user perceive the results? One product at LinkedIn delivers a set of up to 10 job recommendations. The problem is that users focus on the bad recommendations, rather than the good ones. If nine results are spot on and one is off, the user will leave thinking that the entire product is terrible. One bad experience can spoil a consistently good experience. If, over five web sessions, we show you 49 perfect results in a row, but the 50th one doesn’t make sense, the damage is still done. It’s not quite as bad as if the bad result appeared in the first session, but it’s still done, and it’s hard to recover. The most common guideline is to strive for a distribution in which there are many good results, a few great ones, and no bad ones.
That’s only part of the story. You don’t really know what the user will consider a poor recommendation. Here are two sets of job recommendations:
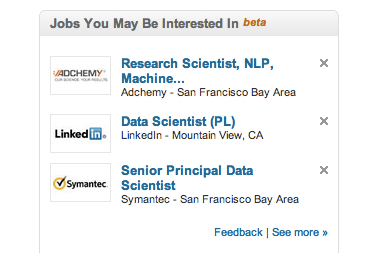
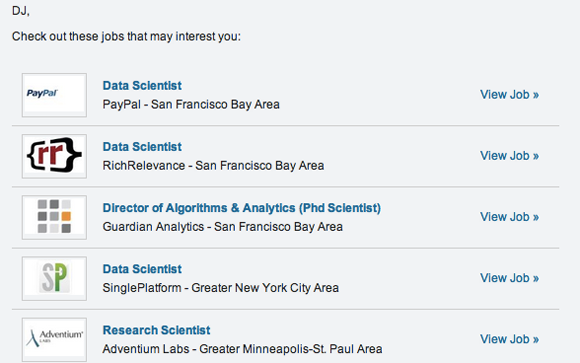
What’s important: The job itself? Or the location? Or the title? Will the user consider a recommendation “bad” if it’s a perfect fit, but requires him to move to Minneapolis? What if the job itself is a great fit, but the user really wants “senior” in the title? You really don’t know. It’s very difficult for a recommendation engine to anticipate issues like these.
Enlisting other users
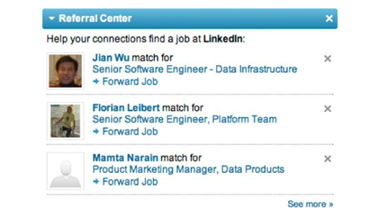
One jujitsu approach to solving this problem is to flip it around and use the social system to our advantage. Instead of sending these recommendations directly to the user, we can send the recommendations to their connections and ask them to pass along the relevant ones. Let’s suppose Mike sends me a job recommendation that, at first glance, I don’t like. One of these two things is likely to happen:
- I’ll take a look at the job recommendation and realize it is a terrible recommendation and it’s Mike’s fault.
- I’ll take a look at the job recommendation and try to figure out why Mike sent it. Mike may have seen something in it that I’m missing. Maybe he knows that the company is really great.
At no time is the system being penalized for making a bad recommendation. Furthermore, the product is producing data that now allows us to better train the models and increase overall precision. Thus, a little twist in the product can make a hard relevance problem disappear. This kind of cleverness lets you take a problem that’s extraordinarily challenging and gives you an edge to make the product work.
Ask and you shall receive
We often focus on getting a limited set of data from a user. But done correctly, you can engage the user to give you more useful, high-quality data. For example, if you’re building a restaurant recommendation service, you might ask the user for his or her zip code. But if you also ask for the zip code where the user works, you have much more information. Not only can you make recommendations for both locations, but you can predict the user’s typical commute patterns and make recommendations along the way. You increase your value to the user by giving the user a greater diversity of recommendations.
In keeping with Data Jujitsu, predicting commute patterns probably shouldn’t be part of your first release; you want the simplest thing that could possibly work. But asking for the data gives you the potential for a significantly more powerful and valuable product.
Take heed not just to demand data. You need to explain to the user why you’re asking for data; you need to disarm the user’s resistance to providing more information by telling him that you’re going to provide value (in this case, more valuable recommendations), rather than abusing the data. It’s essential to remember that you’re having a conversation with the user, rather than giving him a long form to fill out.
Anticipate failure
As we’ve seen, data products can fail because of relevance problems arising from the tradeoff between precision and recall. Design your product with the assumption that it will fail. And in the process, design it so that you can preserve the user experience even if it fails.
Two data products that demonstrate extremes in user experience are Sony’s AIBO (a robotic pet), and interactive voice response systems (IVR), such as the ones that answer the phone when you call an airline to change a flight.
Let’s consider the AIBO first. It’s a sophisticated data product. It takes in data from different sensors and uses this data to train models so that it can respond to you. What do you do if it falls over or does something similarly silly, like getting stuck walking into a wall? Do you kick it? Curse at it? No. Instead, you’re likely to pick it up and help it along. You are effectively compensating for when it fails. Let’s suppose instead of being a robotic dog, it was a robot that brought hot coffee to you. If it spilled the coffee on you, what would your reaction be? You might both kick it and curse at it. Why the difference? The difference is in the product’s form and execution. By making the robot a dog, Sony limited your expectations; you’re predisposed to cut the robot slack if it doesn’t perform correctly.
Now, let’s consider the IVR system. This is also a sophisticated data product. It tries to understand your speech and route you to the right person, which is no simple task. When you call one these systems, what’s your first response? If it is voice activated, you might say, “operator.” If that doesn’t work, maybe you’ll say “agent” or “representative.” (I suspect you’ll be wanting to scream “human” into the receiver.) Maybe you’ll start pressing the button “0.” Have you ever gone through this process and felt good? More often than not, the result is frustration.
What’s the difference? The IVR product inserts friction into the process (at least from the customer’s perspective), and limits his ability to solve a problem. Furthermore, there isn’t an easy way to override the system. Users think they’re up against a machine that thinks it is smarter than they are, and that is keeping them from doing what they want. Some could argue that this is a design feature, that adding friction is a way of controlling the amount of interaction with customer service agents. But, the net result is frustration for the customer.
You can give your data product a better chance of success by carefully setting the users’ expectations. The AIBO sets expectations relatively low: A user doesn’t expect a robotic dog to be much other than cute. Let’s think back to the job recommendations. By using Data Jujitsu and sending the results to the recipient’s network, rather than directly to him, we create a product that doesn’t act like an overly intelligent machine that the user is going to hate. By enlisting a human to do the filtering, we put a human face behind the recommendation.
One under-appreciated facet of designing data products is how the user feels after using the product. Does he feel good? Empowered? Or disempowered and dejected? A product like the AIBO, or like job recommendations sent via a friend, is structured so that the user is predisposed toward feeling good after he’s finished.
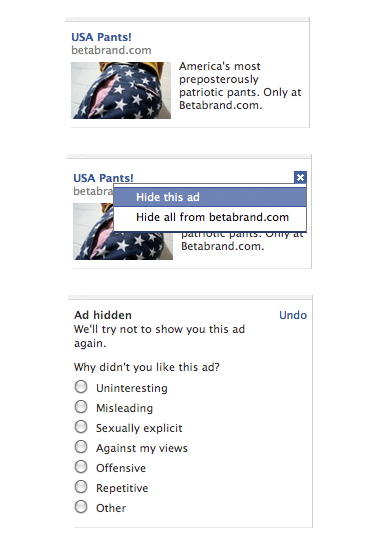
In many applications, a design treatment that gives the user control over the outcome can go far to create interactions that leave the user feeling good. For example, if you’re building a collaborative filter, you will inevitably generate incorrect recommendations. But you can allow the user to tell you about poor recommendations with a button that allows the user to “X” out recommendations he doesn’t like.
Facebook uses this design technique when they show you an ad. They also give you control to hide the ad, as well as an an opportunity to tell them why you don’t think the ad is relevant. The choices they give you range from not being relevant to being offensive. This provides an opportunity to engage users as well as give them control. It turns annoyance into empowerment; rather than being a victim of the bad ad targeting, users get to feel that they can make their own recommendations about which ads they will see in the future.
Putting Data Jujitsu into practice
You’ve probably recognized some similarities between Data Jujitsu and some of the thought behind agile startups: Data Jujitsu embraces the notion of the minimum viable product and the simplest thing that could possibly work. While these ideas make intuitive sense, as engineers, many of us have to struggle against the drive to produce a beautiful, fully-featured, massively complex solution. There’s a reason that Rube Goldberg cartoons are so attractive. Data Jujitsu is all about saying “no” to our inner Rube Goldberg.
I talked at the start about getting clean data. It’s impossible to overstress this: 80% of the work in any data project is in cleaning the data. If you can come up with strategies for data entry that are inherently clean (such as populating city and state fields from a zip code), you’re much better off. Work done up front in getting clean data will be amply repaid over the course of the project.
A surprising amount of Data Jujitsu is about product design and user experience. If you can design your product so that users are predisposed to cut it some slack when it’s wrong (like the AIBO or, for that matter, the LinkedIn job recommendation engine), you’re way ahead. If you can enlist your users to help, you’re ahead on several levels: You’ve made the product more engaging, and you’ve frequently taken a shortcut around a huge data problem.
The key aspect of making a data product is putting the “product” first and “data” second. Saying it another way, data is one mechanism by which you make the product user-focused. With all products, you should ask yourself the following three questions:
- What do you want the user to take away from this product?
- What action do you want the user to take because of the product?
- How should the user feel during and after using your product?
If your product is successful, you will have plenty of time to play with complex machine learning algorithms, large computing clusters running in the cloud, and whatever you’d like. Data Jujitsu isn’t the end of the road; it’s really just the beginning. But it’s the beginning that allows you to get to the next step.
 Strata Conference + Hadoop World — The O’Reilly Strata Conference, being held Oct. 23-25 in New York City, explores the changes brought to technology and business by big data, data science, and pervasive computing. This year, Strata has joined forces with Hadoop World. Save 20% on registration with the code RADAR20
Related:
- Download a free copy of Data Jujitsu
- Building data science teams
- The evolution of data products
- Designing great data products