

Thirteen years ago, in 2001, the World Wide Web Consortium (W3C) finalized the specification for Scalable Vector Graphics, version 1.0. A few months later, in early 2002, O’Reilly published the original SVG Essentials, describing both the basics and the wonderful potential of SVG. An open standard for vector graphics, with support for scripting and animation, was an area of boundless possibility.
From some perspectives, not much has changed. The official SVG specification is still at version 1.1, which was released in 2003 and edited in 2011. Neither update introduced new features to SVG, instead focusing on improving clarity and consistency in the details.
In practice, however, SVG has changed considerably. There are numerous tools for creating SVG, both full-featured graphics programs and online widgets. Most importantly, nearly every web browser out there treats SVG as a first-class citizen (some outdated mobile and Internet Explorer versions being exceptions), displaying SVG as an interactive part of your document with no need for plug-ins.
As we release the updated SVG Essentials, Second Edition this week, we thought it would be useful to look back and consider all the things SVG makes easy now that were difficult previously, and also look forward at the features we hope to see in the future.
Pre-History
Before SVG, the web was the domain of low-resolution, bitmapped graphics and slow-to-download photographs. Vector graphics were for print publishing (using the PostScript language) or technical drafting (using AutoCAD’s DWG format or its competitors).
If you wanted an icon on your webpage, you used GIF or the newfangled PNG format. If you wanted it animated, you definitely used GIF. GIFs were (are?) great, but they have a fixed resolution and no control over the animation loop. Making the icon larger, or the animation longer, significantly increases the file size.

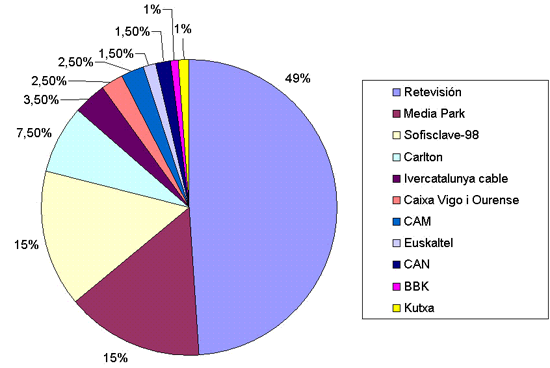
Including a chart of your latest budget data on your site? Again, a GIF, PNG, or maybe a JPEG would have to do. Even if you chose a file format and resolution that didn’t add unfortunate compression effects, the data the chart represents is trapped in the image. Label text is inaccessible to screen readers or search engines, and the numbers used to generate the graph can only be roughly estimated. Reverse-engineering a pie chart is no easy task, although there’s an extensive school of research devoted to it.
Want to use artistic effects such as blurred splash page to welcome visitors to your website? You would use a graphics editor like Adobe Photoshop or GIMP to create a new blurred image to upload to your server, of course. If the website also needed the original, then you would upload—and your site’s visitors would download—both files.
In 1998, as XML became the standard for defining software-independent data files, two proposals for XML-based vector graphics were submitted to the W3C. Instead of adopting either Adobe’s Precision Graphics Markup Language proposal or Microsoft’s Vector Markup Language alternative, a working group was established to create the unified Scalable Vector Graphics definition. (It didn’t prevent Microsoft from implementing VML in Internet Explorer, standards be darned.)
Pioneer Days
Back in 2002, the W3C didn’t wait for working implementations of its specifications before recommending them. However, early adoption seemed promising.
Adobe created an SVG viewer plug-in for Internet Explorer and Netscape Navigator within months of the specification being drafted. If you stuck to open source software, Apache Batik was pretty much the only tool available that could display any SVG 1.0 file. A Java application, Batik could also run on a server or workstation to convert SVG code to rasterized graphics of the necessary resolution.
To produce drawings in SVG format, you could convert an Adobe Illustrator file, or use the Sodipodi editor, a fore-runner to Inkscape—that is, if you weren’t hard-core enough to write the code in an XML editor.
A look through the proceedings of the early SVG Open conferences, first held in July 2002, gives you an idea of how people were using SVG. Web cartography was a big part—the GIS community embraced the possibilities of clear, crisp drawings that could be dynamically updated or magnified—but diverse other fields were involved, including computer-aided design, data mining and visualization of complex scientific and technical information, and most importantly, web cartoons. Additionally, many icon sets for the KDE and GNOME desktop environments on Linux were (and still are!) drawn in SVG.
The Dark Ages
But then progress stalled. Browsers diversified, but the Adobe SVG Viewer didn’t work in Chrome, Firefox, or Safari. And when Adobe acquired Macromedia Flash in 2005, their interests in the field of dynamic vector graphics for the web were divided. (All support for the SVG Viewer was discontinued in 2009).
Plans for expanding the SVG specifications to include features available in Flash, such as text that wraps into paragraphs, were abandoned in 2005, although some additions made it into the SVG Tiny specification—an otherwise simplified (and now mostly obsolete) version of SVG for mobile devices.
SVG was on the web, but it was not part of the web, separated by the need for a plug-in or separate program. For key vector graphic applications like interactive maps or data charts, the benefits might outweigh the costs. For cute animations and glossy photographic backgrounds? Not so much.
If you did have the software, however, you could do a lot of interesting things. The following graphic uses the XSLT language to convert a simple XML data file into an interactive SVG version of the basic Excel pie chart. It’s still not a great data visualization—you really shouldn’t use a pie chart with this many slices—but now it scales smoothly, the text is accessible to a browser that can’t display the image, and if you select a label the corresponding pie slice will be highlighted (if you’re using a browser that supports SVG animation).
The Renaissance
The path of SVG started to turn in 2008, when first Firefox and then Safari released implementations of SVG for the browser, without requiring plug-ins. Projects like SVG Wow! sought to demonstrate the full glory of SVG, mixing vector art, photographic filters, and interactive animation.
SVG got an indirect boost in 2010, when Steve Jobs announced that Apple would never support Flash player on iOS devices. Also in 2010, Google started taking advantage of the machine-readable text in SVG files, including them in search data. By 2011, when Internet Explorer 9 was released, the latest versions of all major desktop browsers could support the core features of SVG as embedded objects or as inline SVG code, plunked straight into an HTML5 document.
This spurt of SVG support came with plenty of growing pains. The browsers are still working on implementing some of the more complex aspects of the original specifications. Features that were standard when the Adobe SVG viewer was the only game in town, like animations and custom fonts, are now compatibility minefields. At the same time, inline SVG opens up new uses, like small inline icons, that weren’t considered 12 years ago.
Which is why it was time to publish an updated SVG Essentials.
The basic information on how to draw and style shapes hasn’t changed, but the way a graphic fits into a web page is much different. Furthermore, cross-browser compatibility, which wasn’t much of an issue when there were only a pair of plugins that could render SVG, is now a major concern. In the new book, we highlight some of the most serious compatibility issues, but the same rule applies that governs all other aspects of web design: test it, test it, test it!
The Here and Now
Developers continue to come up with great ways to use SVG, from typesetting musical notation, to meteorological plotting. On the web, it would be overselling things to say that SVG is taking over; according to W3Techs.com, it’s used by only 0.4% of web sites, with an upward trend since 2013. But for new mobile-friendly sites, SVG is becoming the default for icons, with extensive sets available from iconmelon, Open Iconic, flaticon, and snipicons, to name a few. If you are looking for clip art, there’s openclipart. There are even easy-to-use web-tools like SVG Circus, which allows you to generate custom animations with a few clicks.
But for true customization, you can still open up your XML editor and tweak your graphic just the way you like it. Here’s a modern take on that smiley GIF. Except now it sizes smoothly with the surrounding font, and only waves if you hover it. (Note, Internet Explorer is still a hold-out on SVG animation support).
For charts, the D3.js library has made SVG the standard for dynamic data visualizations; explore the gallery to see what can happen when talented designers combine SVG and D3. For standard chart types, there are now many add-on libraries that can create a stylish, interactive chart with a few lines of Javascript code; the updated pie chart uses NVD3 from Novus Partners and took considerably less time to create than the XSLT version.
But probably the least known feature of SVG is how it can be used to dress up photographic images. Microsoft put together some great interactive examples of SVG filters when IE10 first started supporting them. For the blur-and-reveal web site, using SVG not only means that you can skip the pre-processing step (and can easily swap in new photos), but also that you will cut the bandwidth hit in half.
The Future
The W3C’s SVG Working Group is still working on a successor SVG2 specification which will support complex topographical gradients, connectors between shapes (that move when the shapes do), multiline text that wraps to shape outlines, embedded media, and greater CSS control of SVG layout, including media queries. Exactly when that will happen, we’re not sure.
The long delay in updating the specification has caused other quirks. While web browsers have been catching up to the 13-year-old SVG specifications, they’ve been rushing ahead to implement experimental CSS specifications. Many of these apply SVG-inspired features—gradients, shadows, animation and transformations—to HTML elements. CSS animation and transformations also work fairly well with SVG elements (in most browsers), but there are some important differences from their SVG equivalents. Switching between the two can be tricky, and that’s before you deal with CSS browser prefixes. We touch on the CSS alternatives in the book to show the differences, while warning that those working draft specifications might still change.
A decade from now (and probably much sooner), you will be able to add a three-dimensional twist to that smiley’s waving hand—and maybe by then, IE will support animation. More importantly, you’ll be able to make it respond to keyboard as well as pointer events—a tabIndex attribute is part of SVG2. For charts and diagrams, the biggest improvement will be to allow responsive layout changes without JavaScript. You’ll be able to use media queries to shift the legend’s position in landscape versus portrait mode, and set the label text to maintain a legible size, even as the image scales to fit the window. And you won’t even have to use an <svg> element to blur a photograph, since you’ll be able to apply SVG filters directly to HTML content.
The era of boundless possibilities for SVG is returning. Animations, charts, glossy photo spreads, whatever you want. SVG is to graphics what HTML is to text; it provides the tool, but you provide the inspiration.
Just don’t assume that SVG is only for graphic artists. If it were, we wouldn’t be the ones writing this.
Editor’s note: The author would like to thank her co-author, J. David Eisenberg, for contributing to the research and examples for this post.
Public domain architectural spline illustration courtesy of Internet Archive.