Julie Steele

Julie Steele is the Content Editor for Strata at O’Reilly Media. She is co-author of Beautiful Visualization and Designing Data Visualizations. She finds beauty in exploring complex systems, and thinks in metaphors. The best part of her day is finding patterns across verticals and traditional silos, and connecting people who are working on similar problems in seemingly unrelated areas. She is particularly drawn to the visual medium as a way to understand and transmit information.
Julie holds a Master’s degree in Political Science (International Relations) from Rutgers University in Newark. She lives in New York City, where she cooks, reads, designs, and practices yoga.
Not just big data, but better data
Five ways we can improve the information we collect to help us solve hard problems in health care.
I was honored to chair O’Reilly’s inaugural edition of Strata Rx, our conference on data science in health care, this past October along with Colin Hill. As we’re beginning to plan this year’s event, I find myself thinking a lot about a theme that emerged from some of the keynotes last fall: in order to solve the problems we’re facing in health care — to lower costs and provide more personal, targeted treatments to patients — we don’t just need more data; we need better data.
Much has been made about the era of big data we find ourselves in. But though the data we collect is straining the limits of our tools and models, we’re still not making the kind of headway we hoped for in areas like health care. So big data isn’t enough. We need better data.
What does it mean to have better data in health care? Here are some things on my list; perhaps you can think of others. Read more…
Eyebeam Update: Two months after Sandy
Eyebeam is turning the road to recovery into an opportunity for progress, but getting it done will take a whole community.
A couple of months ago, I wrote about the new media and design incubator in NYC, Eyebeam, and the damage they’d suffered in Hurricane Sandy. This week I caught up with Eyebeam executive director Pat Jones to find out what kind of progress has been made in the cleanup.
The three feet of polluted water that flooded Eyebeam’s work and exhibit space on the West Side of Manhattan during the storm had damaged lots of equipment and soaked much of their archive material. Cleaning whatever could be saved and making a priority list for replacing what was lost were the two main challenges of recovery.
Thanks to generous contributions from philanthropic foundations and private companies — such as the Jerome Foundation, the Andy Warhol Foundation for the Visual Arts, the Andrew W. Mellon Foundation, the Art Dealers Association of America, Time-Warner, and O’Reilly Media — as well as donations from individuals, about half the equipment losses have been covered.
There are still some other funding proposals under consideration, but essentially the equipment recovery process has been one of triage: Eyebeam has tried to replace equipment needed immediately by their artists in residence, as well as some practical pieces like the two scissor lifts required to access lights and other equipment at the top of their two-story exhibit space. Read more…
After the storm: Putting Eyebeam back together
The largest not-for-profit art and technology center in the US was devastated by Hurricane Sandy, and you can help
Thanksgiving has come and gone and many of us are busy preparing for the winter holidays. For most of us, Hurricane Sandy is about to become a footnote to a crazy series of news cycles around the 2012 presidential election. But for many individuals and institutions, the cleanup has barely begun.
One of these institutions is the Eyebeam Art + Technology Center in New York, a not-for-profit incubator of new media and design. Each year, Eyebeam hosts two groups of residents for five months each, in addition to several fellows for the full year. Almost 250 artists, designers, and technologists have spent time there since Eyebeam first opened in 1997, many of whom we at O’Reilly have known and admired.
Hurricane Sandy brought more than three feet of water, chemicals, and outside debris sweeping into the streets and buildings on the west side of Manhattan. At Eyebeam, this spelled disaster for much of the equipment and archives on their ground floor. The disaster was compounded by the fact that none of this material was covered by flood insurance.
The main space is currently filled with dried-out computers, projectors, mixers and other audio equipment, and two scissor-lifts used for accessing the upper reaches of their 18-foot-high space. Volunteers are looking over and hand-inspecting it all to figure out what can be salvaged; ultimately, they’ll have to find ways to repair, replace, or do without each item.
As for the archives, volunteers have sorted and washed each piece, and begun the task of cataloging what can be preserved. Alumni will be contacted to see if they can provide copies of their work, but most of the material is now very fragile and will need to be digitized and transferred to more stable formats, a time-consuming and expensive process that is expected to take a year or more.
But with all of this comes the opportunity for Eyebeam to reconsider their goals and how they can make their archives available to a wider audience than before. Read more…
Printing ourselves
At its best, 3D printing can make us more human by making us whole.
Tim O’Reilly recently asked me and some other colleagues which technology seems most like magic to us. There was a thoughtful pause as we each considered the amazing innovations we read about and interact with every day.
I didn’t have to think for long. To me, the thing that seems most like magic isn’t Siri or self-driving cars or augmented reality displays. It’s 3D printing.
My reasons are different than you might think. Yes, it’s amazing that, with very little skill, we can manufacture complex objects in our homes and workshops that are made from things like plastic or wood or chocolate or even titanium. This seems an amazing act of conjuring that, just a short time ago, would have been difficult to imagine outside of the “Star Trek” set.
But the thing that makes 3D printing really special is the magic it allows us to perform: the technology is capable of making us more human. Read more…
The miracle of a thumbnail image from Mars
The Curiosity rover marked its Mars landing with a small photo. Think about all the work that went into that one shot.
Last night, I stayed up late to watch the NASA livestream of the Curiosity rover landing. It seems to have been an unmitigated success: each step of the entry and landing process, even that crazy sky-crane maneuver, was performed flawlessly.
As Travis Beacham put it on Twitter:
A jet-fired hover crane just lowered a nuclear robot bigger than my car onto Mars. Then it emailed us pics, from the other side of the sun.
— Travis Beacham (@travisbeacham) August 6, 2012
Although there were tearful hugs and high-fives and all manner of cheering when “Touchdown!” was called, the wonderment built to a real climax when the first thumbnail image came through. It was small, in black and white, and showed the Martian horizon in the background, with the wheel of the rover in the foreground.
Shortly thereafter, a slightly larger version was displayed: still black and white, but with enough resolution to show dust on the glass. A second one followed a few minutes later, showing the rover’s shadow on the ground. Cue the “pics or it didn’t happen” jokes, as well as the rapid proliferation of Photoshopped spoofs.
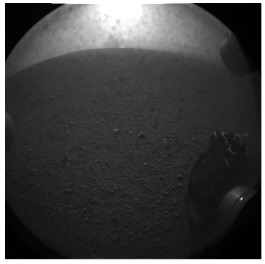
One of the first images from the Curiosity rover.
In our micro-culture of the moment, obsessed with photo sharing and images, this tiny thumbnail still seemed like a miracle (albeit a required one). A picture really is worth a whole lot of words. But have you ever stopped to think about what it takes to plan for that from Mars?
Why data visualization matters
The best data visualizations expose something new.
Effective data visualizations go beyond aesthetics; they also allow organizations to make quick and correct decisions from massive amounts of information.
Data and the human-machine connection
Opera Solutions' Arnab Gupta says human plus machine always trumps human vs machine.
Managing data and extracting meaning require new approaches, new education, and even a new language. Opera Solutions CEO Arnab Gupta discusses each of these areas in the following interview.
Dusting for device fingerprints
BlueCava can identify specific Internet-connected devices and how they're used. Is this the future of tracking?
BlueCava lets businesses identify devices that are coming to their websites. In this interview, BlueCava CEO David Norris discusses fraud prevention, privacy, and the state of reputation technology.
Data markets aren’t coming. They’re already here
Gnip's Jud Valeski on data resellers, end-user responsibility, and the threat of black markets.
Gnip cofounder and CEO Jud Valeski discusses data markets (and black markets), social media, and real-time data's impact on customer relations.
Data markets aren't coming. They're already here
Gnip's Jud Valeski on data resellers, end-user responsibility, and the threat of black markets.
Gnip cofounder and CEO Jud Valeski discusses data markets (and black markets), social media, and real-time data's impact on customer relations.