"data scientist" entries

Data Analysis: Just one component of the Data Science workflow
Specialized tools run the risk of being replaced by others that have more coverage
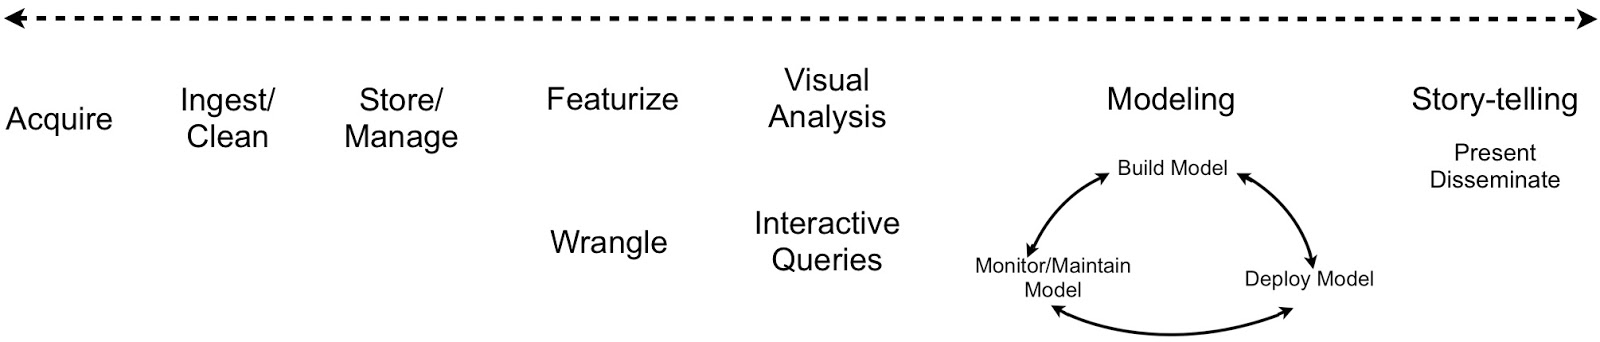
Judging from articles in the popular press the term data scientist has increasingly come to refer to someone who specializes in data analysis (statistics, machine-learning, etc.). This is unfortunate since the term originally described someone who could cut across disciplines. Far from being confined to data analysis, a typical data science workflow1 means jumping back-and-forth between a series of interdependent tasks. Data scientists tend to use a variety of tools, often across different programming languages. Workflows that involve many different tools require a lot of context-switching which affects productivity and impedes reproducability:
Tools and Training
People who build tools appreciate the value of having their solutions span across the data science workflow. If a tool only addresses a limited section of the workflow, it runs the risk of being replaced by others that have more coverage. Platfora is as proud of its data store (the fractal cache) and data wrangling2 tools, as of its interactive visualization capabilities. The Berkeley Data Analytics Stack (BDAS) and the Hadoop community are expanding to include analytic engines that increase their coverage – over the next few months BDAS components for machine-learning (MLbase) and graph analytics (GraphX) are slated for their initial release. In an earlier post, I highlighted a number of tools that simplify the application of advanced analytics and the interpretation of results. Analytic tools are getting to the point that in the near future I expect many (routine) data analysis tasks will be performed by business analysts and other non-experts.
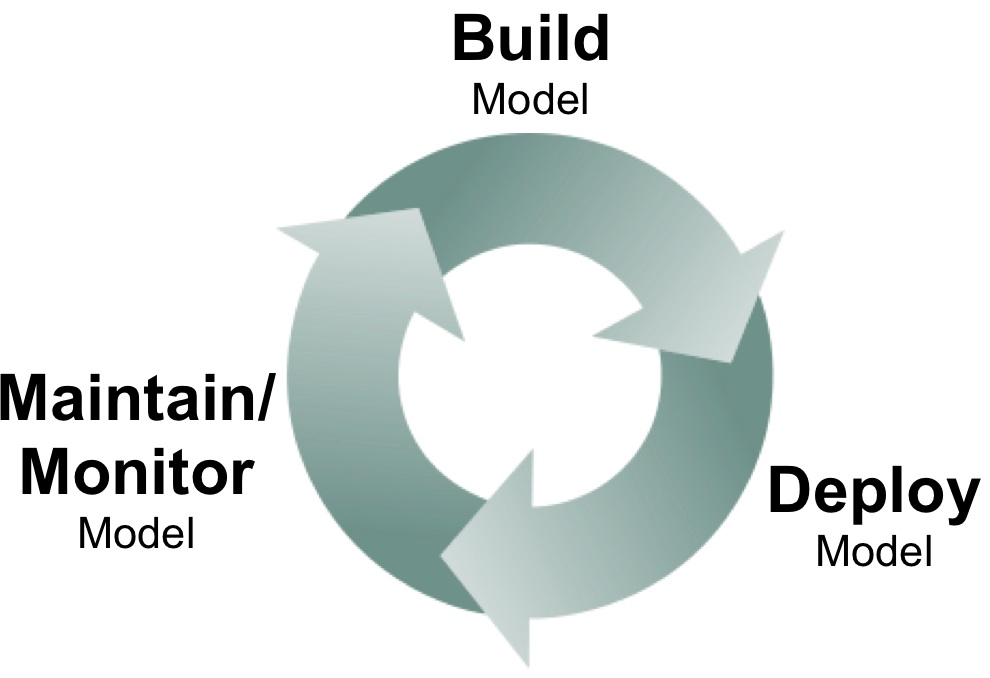
Data scientists tackle the analytic lifecycle
A new crop of data science tools for deploying, monitoring, and maintaining models
What happens after data scientists build analytic models? Model deployment, monitoring, and maintenance are topics that haven’t received as much attention in the past, but I’ve been hearing more about these subjects from data scientists and software developers. I remember the days when it took weeks before models I built got deployed in production. Long delays haven’t entirely disappeared, but I’m encouraged by the discussion and tools that are starting to emerge.
The problem can often be traced to the interaction between data scientists and production engineering teams: if there’s a wall separating these teams, then delays are inevitable. In contrast having data scientists work more closely with production teams makes rapid iteration possible. Companies like Linkedin, Google, and Twitter work to make sure data scientists know how to interface with their production environment. In many forward thinking companies, data scientists and production teams work closely on analytic projects. Even a high-level understanding of production environments help data scientists develop models that are feasible to deploy and maintain.
Model Deployment
Models generally have to be recoded before deployment (e.g., data scientists may favor Python, but production environments may require Java). PMML, an XML standard for representing analytic models, has made things easier. Companies who have access to in-database analytics1, may opt to use their database engines to encode and deploy models.
HBase looks more appealing to data scientists
New open source tools for interactive SQL analysis, model development and deployment
When Hadoop users need to develop apps that are “latency sensitive”, many of them turn to HBase1. Its tight integration with Hadoop makes it a popular data store for real-time applications. When I attended the first HBase conference last year, I was pleasantly surprised by the diversity of companies and applications that rely on HBase. This year’s conference was even bigger and I ran into attendees from a wide range of companies. Another set of interesting real-world case studies were showcased, along with sessions highlighting work of the HBase team aimed at improving usability, reliability, and availability (bringing down mean time to recovery has been a recent area of focus).

HBase has had a reputation of being a bit difficult to use – its core users have been data engineers, not data scientists. The good news is that as HBase gets adopted by more companies, tools are being developed to open it up to more users. Let me highlight some tools that will appeal to data scientists.

Steering the ship that is data science
Ideas on avoiding the data science equivalent of "repair-ware."
Mike Loukides recently recapped a conversation we’d had about leading indicators for data science efforts in an organization. We also pondered where the role of data scientist is headed and realized we could treat software development as a prototype case.
It’s easy (if not eerie) to draw parallels between the Internet boom of the mid 1990s and the Big Data boom of the present day: in addition to the exuberance in the press and the new business models, a particular breed of technical skill became a competitive advantage and a household name. Back then, this was the software developer. Today, it’s the data scientist.
The time in the sun improved software development in some ways, but it also brought its share of problems. Some companies were short on the skill and discipline required to manage custom software projects, and they were equally ill-equipped to discern the true technical talent from the pretenders. That combination led to low-quality software projects that simply failed to deliver business value. (A number of these survive today as “repair-ware” that requires constant, expensive upkeep.)
Simpler workflow tools enable the rapid deployment of models
The importance of data science tools that let organizations easily combine, deploy, and maintain algorithms
Data science often depends on data pipelines, that involve acquiring, transforming, and loading data. (If you’re fortunate most of the data you need is already in usable form.) Data needs to be assembled and wrangled, before it can be visualized and analyzed. Many companies have data engineers (adept at using workflow tools like Azkaban and Oozie), who manage1 pipelines for data scientists and analysts.
A workflow tool for data analysts: Chronos from airbnb
A raw bash scheduler written in Scala, Chronos is flexible, fault-tolerant2, and distributed (it’s built on top of Mesos). What’s most interesting is that it makes the creation and maintenance of complex workflows more accessible: at least within airbnb, it’s heavily used by analysts.
Job orchestration and scheduling tools contain features that data scientists would appreciate. They make it easy for users to express dependencies (start a job upon the completion of another job), and retries (particularly in cloud computing settings, jobs can fail for a variety of reasons). Chronos comes with a web UI designed to let business analysts3 define, execute, and monitor workflows: a zoomable DAG highlights failed jobs and displays stats that can be used to identify bottlenecks. Chronos lets you include asynchronous jobs – a nice feature for data science pipelines that involve long-running calculations. It also lets you easily define repeating jobs over a finite time interval, something that comes in handy for short-lived4 experiments (e.g. A/B tests or multi-armed bandits).
Data Science tools: Are you “all in” or do you “mix and match”?
It helps to reduce context-switching during long data science workflows.
An integrated data stack boosts productivity
As I noted in my previous post, Python programmers willing to go “all in”, have Python tools to cover most of data science. Lest I be accused of oversimplification, a Python programmer still needs to commit to learning a non-trivial set of tools1. I suspect that once they invest the time to learn the Python data stack, they tend to stick with it unless they absolutely have to use something else. But being able to stick with the same programming language and environment is a definite productivity boost. It requires less “setup time” in order to explore data using different techniques (viz, stats, ML).
Multiple tools and languages can impede reproducibility and flow
On the other end of the spectrum are data scientists who mix and match tools, and use packages and frameworks from several languages. Depending on the task, data scientists can avail of tools that are scalable, performant, require less2 code, and contain a lot of features. On the other hand this approach requires a lot more context-switching, and extra effort is needed to annotate long workflows. Failure to document things properly makes it tough to reproduce3 analysis projects, and impedes knowledge transfer4 within a team of data scientists. Frequent context-switching also makes it more difficult to be in a state of flow, as one has to think about implementation/package details instead of exploring data. It can be harder to discover interesting stories with your data, if you’re constantly having to think about what you’re doing. (It’s still possible, you just have to concentrate a bit harder.)
Python data tools just keep getting better
A variety of tools are making data science tasks easy to do in Python
Here are a few observations inspired by conversations I had during the just concluded PyData conference1.
The Python data community is well-organized:
Besides conferences (PyData, SciPy, EuroSciPy), there is a new non-profit (NumFOCUS) dedicated to supporting scientific computing and data analytics projects. The list of supported projects are currently Python-based, but in principle NumFOCUS is an entity that can be used to support related efforts from other communities.
It’s getting easier to use the Python data stack:
There are tools that facilitate the dissemination and sharing of code and programming environments. IPython2 notebooks allow Python code and markup in the same document. Notebooks are used to record and share complex workflows and are used heavily for (conference) tutorials. As the data stack grows, one of the major pain points is getting all the packages to work properly together (version compatibility is a common issue). In particular setting up environments were all the pieces work together can be a pain. There are now a few solutions that address this issue: Anaconda and cloud-based Wakari from Continuum Analytics, and cloud computing platform PiCloud.
There are many more visualization tools to choose from:
The 2D plotting tool matplotlib is the first tool enthusiasts turn to, but as I learned at the conference, there are a number of other options available. Continuum Analytics recently introduced companion packages Bokeh and Bokeh.js that simplify the creation of static and interactive visualizations using Python. In particular Bokeh is the equivalent of ggplot (it even has an interface that mimics ggplot). With Nodebox, programmers use Python code to create sketches and interactive visualizations that are similar to those produced by Processing. Read more…

Maps not lists: network graphs for data exploration
Preview of upcoming Strata session on data exploration
Amy Heineike is Director of Mathematics for Quid Inc, where she has been since its inception, prototyping and launching the company’s technology for analyzing document sets. Below is the teaser for her upcoming talk at Strata Santa Clara.
I recently discovered that my favorite map is online. It used to hang on my housemate’s wall in our little house in London back in 2005. At the time I was working to understand how London was evolving and changing, and how different policy or infrastructure changes (a new tube line, land use policy changes) would impact that.
The map was originally published as a center-page pull out from the Guardian, showing the ethnic groups that dominate different neighborhoods across the city. The legend was as long as the image, and the small print labels necessitated standing up close, peering and reading, tracing your finger to discover the Congolese on the West Green Road, our neighbors the Portuguese on the Stockwell Road, or the Tamils in Chessington in the distant south west.
Need speed for big data? Think in-memory data management
We're launching an investigation into in-memory data technologies.
By Ben Lorica and Roger Magoulas
In a forthcoming report we will highlight technologies and solutions that take advantage of the decline in prices of RAM, the popularity of distributed and cloud computing systems, and the need for faster queries on large, distributed data stores. Established technology companies have had interesting offerings, but what initially caught our attention were open source projects that started gaining traction last year.
An example we frequently hear about is the demand for tools that support interactive query performance. Faster query response times translate to more engaged and productive analysts, and real-time reports. Over the past two years several in-memory solutions emerged to deliver 5X-100X faster response times. A recent paper from Microsoft Research noted that even in this era of big data and Hadoop, many MapReduce jobs fit in the memory of a single server. To scale to extremely large datasets several new systems use a combination of distributed computing (in-memory grids), compression, and (columnar) storage technologies.
Another interesting aspect of in-memory technologies is that they seem to be everywhere these days. We’re looking at tools aimed at analysts (Tableau, Qlikview, Tibco Spotfire, Platfora), databases that target specific workloads or data types (VoltDB, SAP HANA, Hekaton, Redis, Druid, Kognitio, and Yarcdata), frameworks for analytics (Spark/Shark, GraphLab, GridGain, Asterix/Hyracks), and the data center (RAMCloud, memory Iocality).
We’ll be talking to companies and hackers to get a sense of how in-memory solutions fit into their planning. Along these lines, we would love to hear what you think about the rise of these technologies, as well as applications, companies and projects we should look at. Feel free to reach out to us on Twitter (Ben is @bigdata and Roger is @rogerm) or leave a comment on this post.

Strata Week: Machine learning vs domain expertise
Debating the data skills of machines and experts, a key data move for Microsoft, and Google Analytics gets social.
This week's data news includes another look at the Strata Conference's debate about machine learning versus subject matter expertise, Raghu Ramakrishnan moves from Yahoo to Microsoft, and more social data comes to Google Analytics.