"graphlab" entries

Scaling up data frames
New frameworks for interactive business analysis and advanced analytics fuel the rise in tabular data objects.

Long before the advent of “big data,” analysts were building models using tools like R (and its forerunners S/S-PLUS). Productivity hinged on tools that made data wrangling, data inspection, and data modeling convenient. Among R users, this meant proficiency with data frames — objects used to store data matrices that can hold both numeric and categorical data. A data.frame is the data structure consumed by most R analytic libraries.
But not all data scientists use R, nor is R suitable for all data problems. I’ve been watching with interest the growing number of alternative data structures for business analysis and advanced analytics. These new tools are designed to handle much larger data sets and are frequently optimized for specific problems. And they all use idioms that are familiar to data scientists — either SQL-like expressions, or syntax similar to those used for R data.frame or pandas.DataFrame.
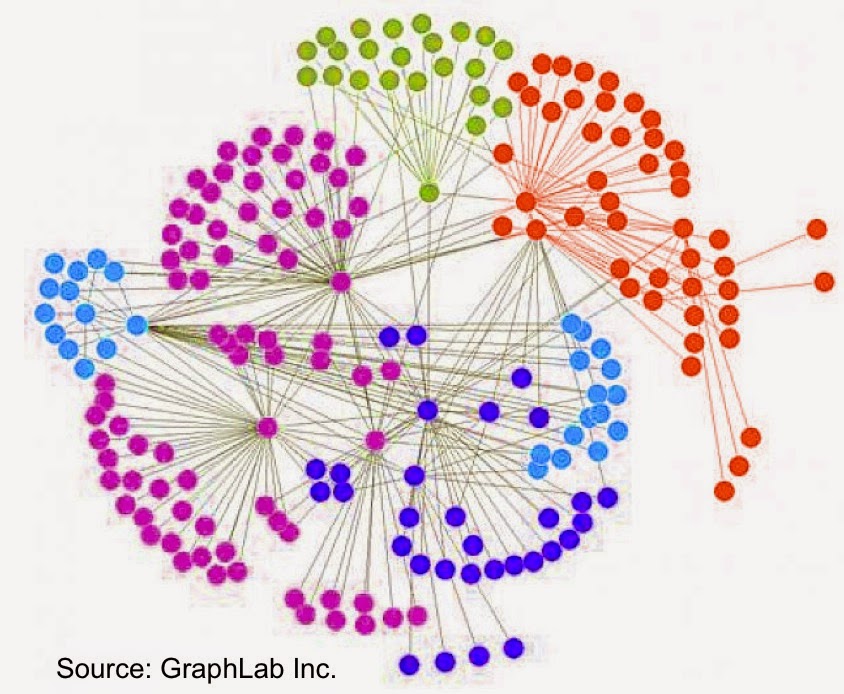
There are many use cases for graph databases and analytics
Business users are becoming more comfortable with graph analytics.
 The rise of sensors and connected devices will lead to applications that draw from network/graph data management and analytics. As the number of devices surpasses the number of people — Cisco estimates 50 billion connected devices by 2020 — one can imagine applications that depend on data stored in graphs with many more nodes and edges than the ones currently maintained by social media companies.
This means that researchers and companies will need to produce real-time tools and techniques that scale to much larger graphs (measured in terms of nodes & edges). I previously listed tools for tapping into graph data, and I continue to track improvements in accessibility, scalability, and performance. For example, at the just-concluded Spark Summit, it was apparent that GraphX remains a high-priority project within the Spark1 ecosystem.
Interface Languages and Feature Discovery
It's easier to "discover" features with tools that have broad coverage of the data science workflow
Here are a few more observations based on conversations I had during the just concluded Strata Santa Clara conference.
Interface languages: Python, R, SQL (and Scala)
This is a great time to be a data scientist or data engineer who relies on Python or R. For starters there are developer tools that simplify setup, package installation, and provide user interfaces designed to boost productivity (RStudio, Continuum, Enthought, Sense).
Increasingly, Python and R users can write the same code and run it against many different execution1 engines. Over time the interface languages will remain constant but the execution engines will evolve or even get replaced. Specifically there are now many tools that target Python and R users interested in implementations of algorithms that scale to large data sets (e.g., GraphLab, wise.io, Adatao, H20, Skytree, Revolution R). Interfaces for popular engines like Hadoop and Apache Spark are also available – PySpark users can access algorithms in MLlib, SparkR users can use existing R packages.
In addition many of these new frameworks go out of their way to ease the transition for Python and R users. wise.io “… bindings follow the Scikit-Learn conventions”, and as I noted in a recent post, with SFrames and Notebooks GraphLab, Inc. built components2 that are easy for Python users to learn.
Extending GraphLab to tables
The popular graph analytics framework extends its coverage of the data science workflow
GraphLab’s SFrame, an interesting and somewhat under-the-radar tool was unveiled1 at Strata Santa Clara. It is a disk-based, flat table representation that extends GraphLab to tabular data. With the addition of SFrame, users can leverage GraphLab’s many algorithms on data stored as either graphs or tables. More importantly SFrame increases GraphLab’s coverage of the data science workflow: it allows users with terabyte-sized datasets to clean their data and create new features directly within GraphLab (SFrame performance can scale linearly with the number of available cores).
The beta version of SFrame can read data from local disk, HDFS, S3 or a URL, and save to a human-readable .csv or a more efficient native format. Once an SFrame is created and saved to disk no reprocessing of the data is needed. Below is Python code that illustrates how to read a .csv file into SFrame, create a new data feature and save it to disk on S3:
GraphChi: Graph analytics over billions of edges using your laptop
A disk-based, single-node, graph analytics system that scales to massive graphs
GraphChi is a spinoff project of GraphLab, an open source, distributed, in-memory software system for analytics and machine-learning.

Designed specifically to run on a single computer with limited memory1 (DRAM), since its release a few months ago GraphChi has been used to analyze graphs with billions of edges. Running on a single machine means deployment and debugging are simpler. In addition it is no longer necessary to find (optimal) graph partitions that minimize communication between compute nodes – the starting point for many distributed graph computations.
The stated goal of GraphChi is to “Compute on graphs with billions of edges, in a reasonable time, on a single PC.” One way to define “reasonable amount of computation time” is to compare against the results produced by other graph processing systems. That’s exactly what GraphChi’s creators did in a recent paper. They found that GraphChi compared favorably to graph analytics packages such as Pegasus and Stanford GPS. While GraphChi was 2-3X slower2 in some cases, it is easier to deploy, easier to debug, and way more energy efficient. Read more…