"stratablog" entries

Big Data solutions through the combination of tools
Applications get easier to build as packaged combinations of open source tools become available
As a user who tends to mix-and-match many different tools, not having to deal with configuring and assembling a suite of tools is a big win. So I’m really liking the recent trend towards more integrated and packaged solutions. A recent example is the relaunch of Cloudera’s Enterprise Data hub, to include Spark1 and Spark Streaming. Users benefit by gaining automatic access to analytic engines that come with Spark2. Besides simplifying things for data scientists and data engineers, easy access to analytic engines is critical for streamlining the creation of big data applications.
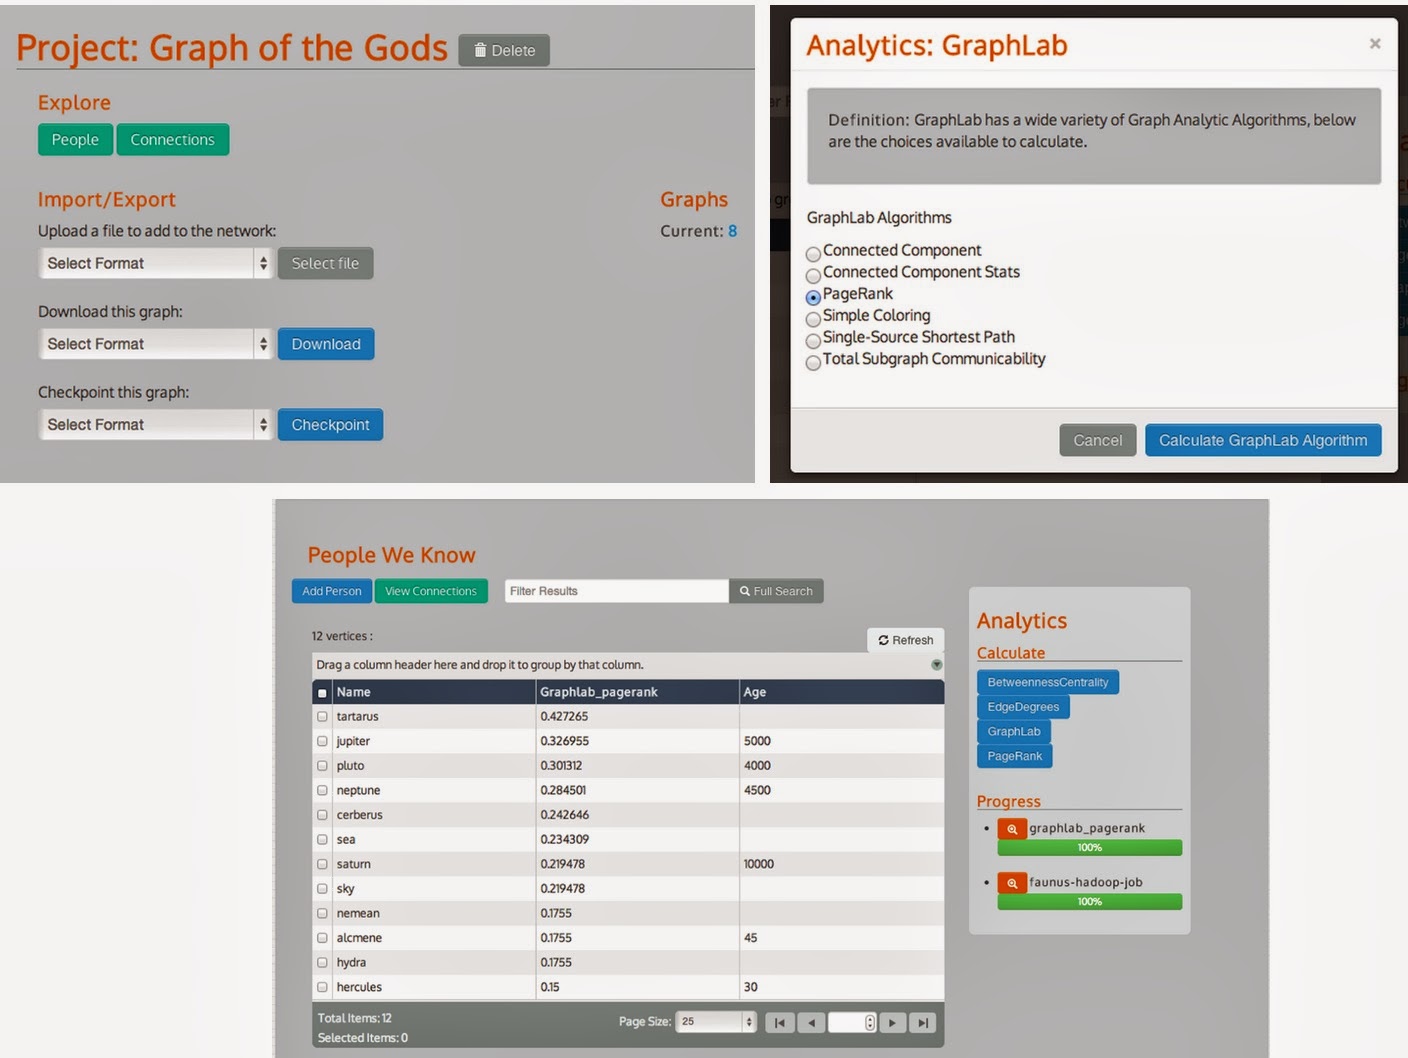
Another recent example is Dendrite3 – an interesting new graph analysis solution from Lab41. It combines Titan (a distributed graph database), GraphLab (for graph analytics), and a front-end that leverages AngularJS, into a Graph exploration and analysis tool for business analysts:

Health technology brings care plans alive
Finalists at Merck|Heritage Provider Network Innovation Challenge
Challenges and hackathons are meant to surprise you. If the winner is a known leader in the field with lists of familiar credentials festooning the team’s resumes, there was no point to starting the challenge in the first place.
Pharmaceutical company Merck and the Heritage Provider Network, the largest physician-led health network in the US, were looking for something new when they launched their challenge on diabetes and heart disease. These conditions are virtual epidemics, world-wide.

The Challenge of Health Data Security
When the death of trust meets the birth of BYOD
Dr. Andrew Litt, Chief Medical Officer at Dell, made a thoughtful blog post last week about the trade-offs inherent in designing for both the security and accessibility of medical data, especially in an era of BYOD (bring your own device) and the IoT (internet of things). As we begin to see more internet-enabled diagnostic and monitoring devices, Litt writes, “The Internet of Things (no matter what you think of the moniker), is related to BYOD in that it could, depending on how hospitals set up their systems, introduce a vast array of new access points to the network. … a very scary thought when you consider the sensitivity of the data that is being transmitted.”
As he went on to describe possible security solutions (e.g., store all data in central servers rather than on local devices), I was reminded of a post my colleague Simon St.Laurent wrote last fall about “security after the death of trust.” In the wake of some high-profile security breaches, including news of NSA activities, St.Laurent says, we have a handful of options when it comes to data security—and you’re not going to like any of them.

How might we …
Human-centered design techniques from an ideation workshop.
By Bo Peng and Aaron Wolf of Datascope Analytics

Bo Peng at a Datascope Analytics Ideation Workshop in Chicago
At Datascope Analytics, our ideation workshop combines elements from human-centered design principles to develop innovative and valuable ideas/solutions/strategies for our clients. From our workshop experience, we’ve developed a few key techniques that have enabled successful communication and collaboration. We complete certain milestones during the workshop: the departure point, the dream view, and curation with gold star voting, among others. These are just a few of the accomplishments that are achieved at various points during the workshop. In addition, we strive to support cultural goals throughout the workshop’s duration: creating an environment that spurs creativity and encourages wild ideas, and maintaining a mediator role. These techniques have thus far proven successful in providing innovative and actionable solutions for our clients.

How does the medical device tax affect innovation and the health/medical startup scene?
Comparative effectiveness research is key to reform
When the Affordable Care Act (ACA) was passed on a party line vote several years ago, it included a somewhat controversial provision to tax, at 2.3% starting in 2013, the sale of any medical device classified by the IRS as being taxable. The list of taxable devices includes a wide variety of products such as defibrillators, dental instruments, pacemakers, coronary stents, artificial hips, joints, and knees, surgical gloves, irradiation equipment, and advanced imaging technology. But it doesn’t stop there—patient monitoring, anesthesiology equipment, infusion pumps, and other hospital operating room digital devices are included in the IRS’s taxable device category. “Consumer” devices such as glucose monitors and potentially many upcoming “wearables” will likely also get taxed either now or soon. That’s where things get difficult for innovators and investors who want to offer next generation devices.
The medical device tax was levied partially to hinder the (over) prescription of medical devices. You and I are most familiar with devices like monitoring instruments or mobile phone sensors, but most dollars are spent on devices like stents, replacement knees, spinal fusion screws, proton beam accelerators, PET/CT scanners, etc. About $200 billion is spent on medical devices per year (about one-third the amount spent on pharmaceutical drugs). The idea behind the tax was twofold. One the one hand, Congress hoped to reduce health spending caused by the overuse of devices by taxing them. But in tandem, the influx of new patients into the health care system is expected to create more sales and revenue for device companies, allowing them to compensate for the excise the tax while bringing in more revenue for Uncle Sam.
Business analysts want access to advanced analytics
Business users are starting to tackle problems that require machine-learning and statistics
I talk with many new companies who build tools for business analysts and other non-technical users. These new tools streamline and simplify important data tasks including interactive analysis (e.g., pivot tables and cohort analysis), interactive visual analysis (as popularized by Tableau and Qlikview), and more recently data preparation. Some of the newer tools scale to large data sets, while others explicitly target small to medium-sized data.
As I noted in a recent post, companies are beginning to build data analysis tools1 that target non-experts. Companies are betting that as business users start interacting with data, they will want to tackle some problems that require advanced analytics. With business analysts far outnumbering data scientists, it makes sense to offload some problems to non-experts2.
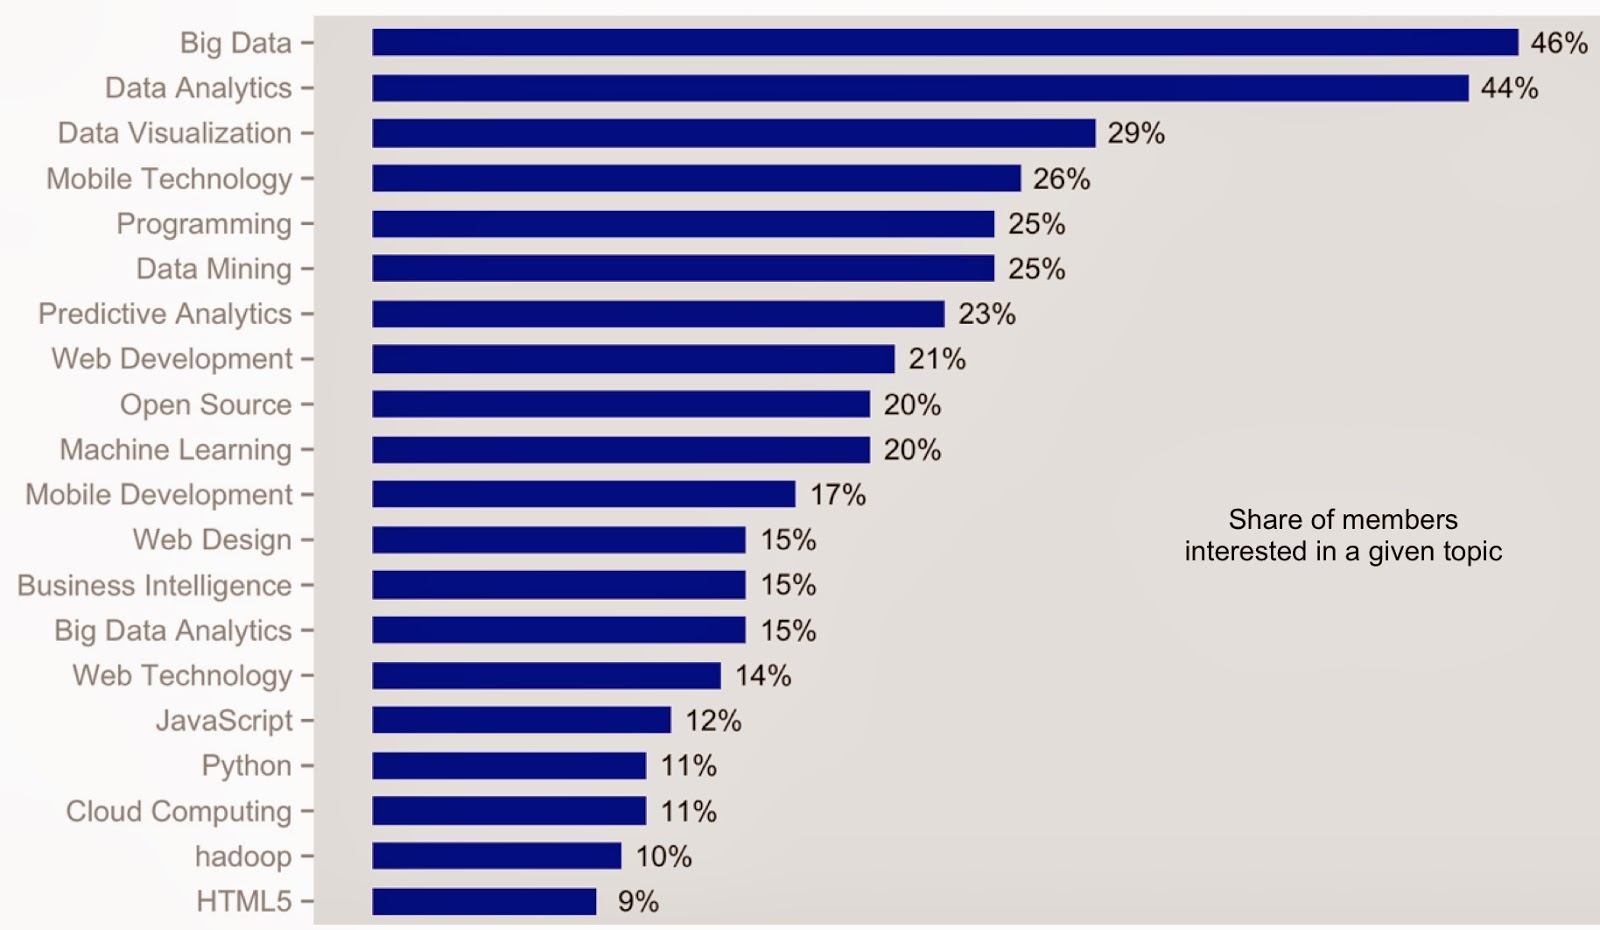
Moreover data seems to support the notion that business users are interested in more complex problems. I recently looked at data3 from 11 large Meetups (in NYC and the SF Bay Area) that target business analysts and business intelligence users. Altogether these Meetups had close to 5,000 active4 members. As you can see in the chart below, business users are interested in topics like machine learning (1 in 5), predictive analytics (1 in 4), and data mining (1 in 4):

Using Big Data and Game Play to Improve Mental Fitness
Digital tools and data analysis to stay sharp, stay well, and overcome illness
This article was written together with Ellen M. Martin and Melinda Speckmann.
Games have been part of human culture for millennia. It is no surprise that elements of play can be powerful digital tools to grab our attention and keep us on a path to taking care of ourselves and others.
Big data is already behind brain games. The use of big data is becoming increasingly mainstream in health play applications. Once we are drawn in, game play (with big data under the hood) can help us to:
- Stay sharp,
- Stay well, and
- Overcome illness.
Health 3.0 is Holistic
If Health 2.0 meant adding devices, then the next wave means incorporating more than just technology
First there was health, which basically consisted of not dying, and also of being able to work and live alone (if need be) and generally function productively. Then there was Health 2.0, in which we added all kinds of gadgets—wrist bands, back bands, sleep monitors, calorie counters—in an attempt to quantify and alter our behavior patterns. But we were still completely focused on the body, and largely ignored the mind.
Health 3.0 is holistic. That means that it incorporates ideas not only about physical well-being, but also about mental well-being. It understands that the mind and body are deeply connected—even though there is still much we fail to understand about the brain. If nothing else, Health 3.0 takes into account that stress is a real thing, with real physical and chemical consequences. Reducing stress and seeking a life of balance is core to the next wave of health care.
In technology circles, we are at both an advantage and a disadvantage when it comes to implementing this next wave. Our advantage is that we understand and appreciate data; we’re prepared with our Health 2.0 sensors and accessories, prepared to deploy them in the name of something even newer and better. Our disadvantage is that, as in so many other industries, many of us still value workaholism and sweat equity. “Start-up” is practically a euphemism for lack of sleep, too much caffeine, and long hours in front of a monitor (hooray for you and your stand-up desk; you’re still probably awash in cortisol).
What I use for data visualization
An array of tools for tackling data visualizations.
Depending on the nature of the problem, data size, and deliverable, I still draw upon an array of tools for data visualization. As I survey the Design track at next month’s Strata conference, I see creators and power users of visualization tools that many data scientists have come to rely on. Several pioneers will lead sessions on (new) tools for creating static and interactive charts, against small and massive data sets.
The Grammar of Graphics
To this day, I find R (specifically ggplot2) to be a tool I turn to for producing static visualizations. Even the simplest charts allow me to quickly spot data problems and anomalies, and a tool like ggplot2 can accomplish a lot in very few lines of code. Charts produced by ggplot2 look much nicer than simple R plots and once you get past the initial learning curve, they are easy to fine-tune and customize.
Hadley Wickham1, the creator of ggplot2, is speaking on two new domain specific languages (ggvis and dplyr) that make it easy for R users to declaratively create interactive web graphics. As Hadley describes it, ggvis is interactive Grammar of Graphics for R. As more data scientists turn to interactive visualizations that can be shared through web browsers, ggvis is the natural next tool for ggplot2 users.
Leland Wilkinson, the primary author of The Grammar of Graphics2, will also be at Strata to lead a tutorial on an interesting expert system that lets machine-learning techniques be accessible to business users. Leland’s work has influenced many other visualization tools including Polaris (from the Stanford team that founded Tableau), Bokeh, and ggbio (for genomics data). Effective visualization techniques will be an important component of his Strata tutorial.
Finding the Meaning in “Meaningful Use”
The 30,000-foot view and the nitty gritty details of working with electronic health data
Ever wonder what the heck “meaningful use” really means? By now, you’ve probably heard it come up in discussions of healthcare data. You might even know that it specifically pertains to electronic health records (EHRs). But what is it really about, and why should you care?
If you’ve ever had to carry a large folder of paper between specialists, or fill out the same medical history form in different offices over and over—with whatever details you happen to remember off the top of your head that day—then you already have some idea of why EHRs are a desirable thing. The idea is that EHRs will lead to better care—and better research data—through more complete and accurate record-keeping, and will eventually become part of health information exchanges (HIEs) with features like trend analysis and push-notifications. However, the mere installation of EHR software isn’t enough; we need not just cursory use but meaningful use of EHRs, and we need to ensure that the software being used meets certain standards of efficiency and security.