
Data journalism has rounded an important corner: The discussion is no longer if it should be done, but rather how journalists can find and extract stories from datasets.
Of course, a dedicated focus on the “how” doesn’t guarantee execution. Stories don’t magically float out of spreadsheets, and data rarely arrives in a pristine form. Data journalism — like all journalism — requires a lot of grunt work.
With that in mind, I got in touch with Simon Rogers, editor of The Guardian’s Datablog and a speaker at next week’s Strata Summit, to discuss the nuts and bolts of data journalism. The Guardian has been at the forefront of data-driven storytelling, so its process warrants attention — and perhaps even full-fledged duplication.
Our interview follows.
What’s involved in creating a data-centric story?
 Simon Rogers: It’s really 90% perspiration. There’s a whole process to making the data work and getting to a position where you can get stories out of it. It goes like this:
- We locate the data or receive it from a variety of sources — from breaking news stories, government data, journalists’ research and so on.
- We then start looking at what we can do with the data. Do we need to mash it up with another dataset? How can we show changes over time?
- Spreadsheets often have to be seriously tidied up — all those extraneous columns and weirdly merged cells really don’t help. And that’s assuming it’s not a PDF, the worst format for data known to humankind.
- Now we’re getting there. Next up we can actually start to perform the calculations that will tell us if there’s a story or not.
- At the end of that process is the output. Will it be a story or a graphic or a visualisation? What tools will we use?
We’ve actually produced a graphic (of how we make graphics) that shows the process we go through:
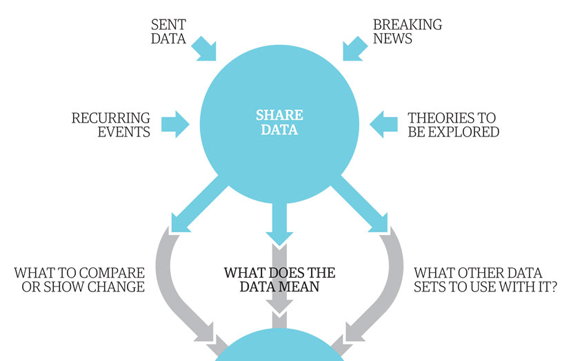
Partial screenshot of “Data journalism broken down.” Click to see the full graphic.
What is the most common mistake data journalists make?
Simon Rogers: There’s a tendency to spend months fiddling around with things that are only mildly diverting. It’s so easy to get sidetracked into statistical curiosities rather than telling stories that really matter. It’s much more important to strive to create amazing work that will be remembered. You won’t always succeed, but you will get closer.
Does data journalism require a team, or is it possible for one person to do all the work?
Simon Rogers: You can go solo. I set up the Datastore and ran it for more than a year on my own. But having a team you can call on is very useful. We have access to people who can scrape sites, people who can work with databases, and graphic designers who can make the results look beautiful. We also work with people out there in the world, bringing their expertise into what we do. With the web, you never have to operate on your own.
 Strata Summit New York 2011, being held Sept. 20-21, is for executives, entrepreneurs, and decision-makers looking to harness data. Hear from the pioneers who are succeeding with data-driven strategies, and discover the data opportunities that lie ahead.
Are the data-driven stories you create updatable?
Simon Rogers: It’s a constant issue. The clever thing is to try to make stuff either incredibly easy to update or something that happens without having to think too much about it. We aren’t quite there yet, but we’re working on it.
What data tools do you use?
Simon Rogers: It’s a very personal thing, that. For us it includes: Excel, TextEdit (it’s amazing how many times you just need to work on code or formulas without formatting), Google Fusion Tables, Google Spreadsheets, Timetric, Many Eyes, Adobe Illustrator, and Tableau.
This interview was edited and condensed.
Related: