"data science" entries

Graphs in the world: Modeling systems as networks
See, extract, and create value with networks.

Networks of all kinds drive the modern world. You can build a network from nearly any kind of data set, which is probably why network structures characterize some aspects of most phenomenon. And yet, many people can’t see the networks underlying different systems. In this post, we’re going to survey a series of networks that model different systems in order to understand different ways networks help us understand the world around us.
We’ll explore how to see, extract, and create value with networks. We’ll look at four examples where I used networks to model different phenomenon, starting with startup ecosystems and ending in network-driven marketing.
Networks and markets
Commerce is one person or company selling to another, which is inherently a network phenomenon. Analyzing networks in markets can help us understand how market economies operate.
Strength of weak ties
Mark Granovetter famously researched job hunting and discovered the Strength of Weak Ties. Read more…

The future of data at scale
The O'Reilly Radar Podcast: Turing Award winner Michael Stonebraker on the future of data science.

Subscribe to the O’Reilly Radar Podcast to track the technologies and people that will shape our world in the years to come.
In March 2015, database pioneer Michael Stonebraker was awarded the 2014 ACM Turing Award “for fundamental contributions to the concepts and practices underlying modern database systems.” In this week’s Radar Podcast, O’Reilly’s Mike Hendrickson sits down with Stonebraker to talk about winning the award, the future of data science, and the importance — and difficulty — of data curation.
One size does not fit all
Stonebraker notes that since about 2000, everyone has realized they need a database system, across markets and across industries. “Now, it’s everybody who’s got a big data problem,” he says. “The business data processing solution simply doesn’t fit all of these other marketplaces.” Stonebraker talks about the future of data science — and data scientists — and the tools and skill sets that are going to be required:
It’s all going to move to data science as soon as enough data scientists get trained by our universities to do this stuff. It’s fairly clear to me that you’re probably not going to retread a business analyst to be a data scientist because you’ve got to know statistics, you’ve got to know machine learning. You’ve got to know what regression means, what Naïve Bayes means, what k-Nearest Neighbors means. It’s all statistics.
All of that stuff turns out to be defined on arrays. It’s not defined on tables. The tools of future data scientists are going to be array-based tools. Those may live on top of relational database systems. They may live on top of an array database system, or perhaps something else. It’s completely open.

Real-time, not batch-time, analytics with Hadoop
How big data, fast data, and real-time analytics work together in the real world.
Attend the VoltDB webcast on June 24, 2015 with John Hugg to learn more on how to build a fast data front-end to Hadoop.
Today, we often hear the phrase “The 3 Vs” in relation to big data: Volume, Variety and Velocity. With the interest and popularity of big data frameworks such as Hadoop, the focus has mostly centered on volume and data at rest. Common requirements here would be data ingestion, batch processing, and distributed queries. These are well understood. Increasingly, however, there is a need to manage and process data as it arrives, in real time. There may be great value in the immediacy of that data and the ability to act upon it very quickly. This is velocity and data in motion, also known as “fast data.” Fast data has become increasingly important within the past few years due to the growth in endpoints that now stream data in real time.
Big data + fast data is a powerful combination. However, adding real-time analytics to this mix provides the business value. Let’s look at a real example, originally described by Scott Jarr of VoltDB.
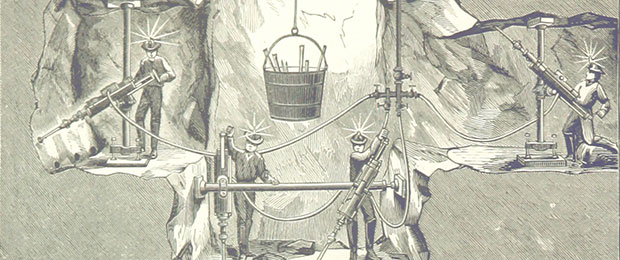
Consider a company that builds systems to manage physical assets in precious metal mines. Inside a mine, there are sensors on miners as well as shovels and other assets. For a lost shovel, minutes or hours of reporting latency may be acceptable. However, a sensor on a miner indicating a stopped heart should require immediate attention. The system should, therefore, be able to receive very fast data. Read more…

Building self-service tools to monitor high-volume time-series data
The O'Reilly Data Show Podcast: Phil Liu on the evolution of metric monitoring tools and cloud computing.
One of the main sources of real-time data processing tools is IT operations. In fact, a previous post I wrote on the re-emergence of real-time, was to a large extent prompted by my discussions with engineers and entrepreneurs building monitoring tools for IT operations. In many ways, data centers are perfect laboratories in that they are controlled environments managed by teams willing to instrument devices and software, and monitor fine-grain metrics.
During a recent episode of the O’Reilly Data Show Podcast, I caught up with Phil Liu, co-founder and CTO of SignalFx, a SF Bay Area startup focused on building self-service monitoring tools for time series. We discussed hiring and building teams in the age of cloud computing, building tools for monitoring large numbers of time series, and lessons he’s learned from managing teams at leading technology companies.
Evolution of monitoring tools
Having worked at LoudCloud, Opsware, and Facebook, Liu has seen first hand the evolution of real-time monitoring tools and platforms. Liu described how he has watched the number of metrics grow, to volumes that require large compute clusters:
One of the first services I worked on at LoudCloud was a service called MyLoudCloud. Essentially that was a monitoring portal for all LoudCloud customers. At the time, [the way] we thought about monitoring was still in a per-instance-oriented monitoring system. [Later], I was one of the first engineers on the operational side of Facebook and eventually became part of the infrastructure team at Facebook. When I joined, Facebook basically was using a collection of open source software for monitoring and configuration, so these are things that everybody knows — Nagios, Ganglia. It started out basically using just per-instance instant monitoring techniques, basically the same techniques that we used back at LoudCloud, but interestingly and very quickly as Facebook grew, this per-instance-oriented monitoring no longer worked because we went from tens or thousands of servers to hundreds of thousands of servers, from tens of services to hundreds and thousands of services internally.

The business value of unifying data
Practical applications of human-in-the-loop machine learning.
With hundreds, thousands, or even just tens of suppliers — each with different business units, payment terms, and locations — businesses are faced with a monumental task: unifying all of their supplier-related data, and fast so that it can be useful. In order to ask deep questions about their data, companies are increasingly looking for a single, unified view of their supply chain.
And yet, business data is often stored in different sources, systems, and formats, resulting in silos of information. These data silos take the form of enterprise resource planning systems, CSV files, spreadsheets, and relational databases. To pull together all of the data from these disparate sources, a business faces three interrelated challenges:
- Speed. Traditionally, businesses have attempted to catalog and organize supply chain data manually — profiling and integrating data themselves, which leads directly to the next challenge: cost.
- Cost. Manual work is expensive work. Usually more than one employee will need to work on the same data set in order to move quickly enough for the results to have any value for the business. Even with several employees working on the same data sets, this work will still not achieve what could be done on a machine scale.
- Efficiency. Relying completely on humans to organize and unify data is a situation ripe for error. Plus, there’s often no audit trail, and the work results in inherently incomplete views of information.
In a recent live demo by Dr. Clare Bernard, a field engineer at Tamr, I got a glimpse into how Tamr is using a combination of machine learning algorithms and input from subject matter experts to help businesses unify their data for analysis. A practice that uses short-term human intervention to actively improve machine models, human-in-the-loop machine learning is taking off across all types of industries, including fashion, automotive, and cloud services such as Google Maps. Read more…

Dimensionality reduction at the command line
Introducing Tapkee, an efficient command-line tool and C++ library for linear and nonlinear dimensionality reduction.
Get 50% off the “Data Science at the Command Line” ebook with code DATA50.
Editor’s Note: This post is a slightly adapted excerpt from Jeroen Janssens’ recent book, “Data Science at the Command Line.” To follow along with the code, and learn more about the various tools, you can install the Data Science Toolbox, a free virtual machine that runs on Microsoft Windows, Mac OS X, and Linux, and has all the command-line tools pre-installed.
The goal of dimensionality reduction is to map high-dimensional data points onto a lower dimensional space. The challenge is to keep similar data points close together on the lower-dimensional mapping. As we’ll see in the next section, our data set contains 13 features. We’ll stick with two dimensions because that’s straightforward to visualize.
Dimensionality reduction is often regarded as being part of the exploring step. It’s useful for when there are too many features for plotting. You could do a scatter plot matrix, but that only shows you two features at a time. It’s also useful as a preprocessing step for other machine-learning algorithms. Most dimensionality reduction algorithms are unsupervised, which means that they don’t employ the labels of the data points in order to construct the lower-dimensional mapping.
In this post, we’ll use Tapkee, a new command-line tool to perform dimensionality reduction. More specifically, we’ll demonstrate two techniques: PCA, which stands for Principal Components Analysis (Pearson, 1901) and t-SNE, which stands for t-distributed Stochastic Neighbor Embedding (van der Maaten & Hinton, 2008). Coincidentally, t-SNE was discussed in detail in a recent O’Reilly blog post. But first, let’s obtain, scrub, and explore the data set we’ll be using. Read more…

Create your graphs with R
A deep-dive into exploratory and presentation graphs.
Buy “Graphing Data with R: An Introduction” in early release. Editor’s note: this is an excerpt of “Graphing Data with R: An Introduction,” by John Jay Hilfiger.
Graphs are useful both for exploration and for presentation. Exploration is the process of analyzing the data and finding relationships and patterns. Presentation of your findings is making your case to others who have not studied the data as intensively as you have yourself. While one is exploring the data, graphs can be stark, lean, and somewhat unattractive. The data analyst, who knows the data and is getting to know it better with each graph made, does not need all the titles, labels, reference details, and colors that someone sitting through a presentation might expect, and might, indeed, find necessary. Furthermore, adding all this stuff just slows down the analyst. Also, some graphs will prove to be dead ends, or just not very interesting. Consequently, many graphs may be discarded during the discovery journey.
As the process of exploration continues, adding some details may make relationships a little clearer. As the analyst gets closer to presentation and/or publication, the graphs become more detailed and prettier. There probably will have been many plain graphs in the process of analysis and relatively few beautiful graphs that appear in the final report. Read more…
Apache Spark: Powering applications on-premise and in the cloud
The O'Reilly Data Show Podcast: Patrick Wendell on the state of the Spark ecosystem.

As organizations shift their focus toward building analytic applications, many are relying on components from the Apache Spark ecosystem. I began pointing this out in advance of the first Spark Summit in 2013 and since then, Spark adoption has exploded.
With Spark Summit SF right around the corner, I recently sat down with Patrick Wendell, release manager of Apache Spark and co-founder of Databricks, for this episode of the O’Reilly Data Show Podcast. (Full disclosure: I’m an advisor to Databricks). We talked about how he came to join the UC Berkeley AMPLab, the current state of Spark ecosystem components, Spark’s future roadmap, and interesting applications built on top of Spark.
User-driven from inception
From the beginning, Spark struck me as different from other academic research projects (many of which “wither away” when grad students leave). The AMPLab team behind Spark spoke at local SF Bay Area meetups, they hosted 2-day events (AMP Camp), and worked hard to help early users. That mindset continues to this day. Wendell explained:
We were trying to work with the early users of Spark, getting feedback on what issues it had and what types of problems they were trying to solve with Spark, and then use that to influence the roadmap. It was definitely a more informal process, but from the very beginning, we were expressly user-driven in the way we thought about building Spark, which is quite different than a lot of other open source projects. We never really built it for our own use — it was not like we were at a company solving a problem and then we decided, “hey let’s let other people use this code for free”. … From the beginning, we were focused on empowering other people and building platforms for other developers, so I always thought that was quite unique about Spark.

Validating data models with Kafka-based pipelines
A case for back-end A/B testing.
Start the O’Reilly “Introduction to Apache Kafka” training video for free. In this video, Gwen Shapira shows developers and administrators how to integrate Kafka into a data processing pipeline.
A/B testing is a popular method of using business intelligence data to assess possible changes to websites. In the past, when a business wanted to update its website in an attempt to drive more sales, decisions on the specific changes to make were driven by guesses; intuition; focus groups; and ultimately, which executive yelled louder. These days, the data-driven solution is to set up multiple copies of the website, direct users randomly to the different variations and measure which design improves sales the most. There are a lot of details to get right, but this is the gist of things.
When it comes to back-end systems, however, we are still living in the stone age. Suppose your business grew significantly and you notice that your existing MySQL database is becoming less responsive as the load increases. Suppose you consider moving to a NoSQL system, you need to decide which NoSQL solution to pick — there are a lot of options: Cassandra, MongoDB, Couchbase, or even Hadoop. There are also many possible data models: normalized, wide tables, narrow tables, nested data structures, etc.
A/B testing multiple data stores and data models in parallel
It is surprising how often a company will pick a solution based on intuition or even which architect yelled louder. Rather than making a decision based on facts and numbers regarding capacity, scale, throughput, and data-processing patterns, the back-end architecture decisions are made with fuzzy reasoning. In that scenario, what usually happens is that a data store and a data model are somehow chosen, and the entire development team will dive into a six-month project to move their entire back-end system to the new thing. This project will inevitably take 12 months, and about 9 months in, everyone will suspect that this was a bad idea, but it’s way too late to do anything about it. Read more…
Announcing Cassandra certification
A new partnership between O’Reilly and DataStax offers certification and training in Cassandra.
 I am pleased to announce a joint program between O’Reilly and DataStax to certify Cassandra developers. This program complements our developer certification for Apache Spark and — just as in the case of Databricks and Spark — we are excited to be working with the leading commercial company behind Cassandra. DataStax has done a tremendous job growing and nurturing the Cassandra community, user base, and technology.
Once the certification program is ready, developers can take the exam online, in designated test centers, and at select training courses. O’Reilly will also be developing books, training days, and videos targeted at developers and companies interested in the Cassandra distributed storage system.
Cassandra is a popular component used for building big data and real-time analytic platforms. Its ability to comfortably scale to clusters with thousands of nodes makes it a popular option for solutions that need to ingest and make sense of large amounts of time series and event data. As noted in an earlier post, real-time event data are at the heart of one of the trends we’re closely following: the convergence of cheap sensors, fast networks, and distributed computation. Read more…