"data science" entries

Data has a shape
Using topology to uncover the shape of your data: An interview with Gurjeet Singh.

Get notified when our free report, “Future of Machine Intelligence: Perspectives from Leading Practitioners,” is available for download. The following interview is one of many that will be included in the report.
As part of our ongoing series of interviews surveying the frontiers of machine intelligence, I recently interviewed Gurjeet Singh. Singh is CEO and co-founder of Ayasdi, a company that leverages machine intelligence software to automate and accelerate discovery of data insights. Author of numerous patents and publications in top mathematics and computer science journals, Singh has developed key mathematical and machine learning algorithms for topological data analysis.
Key Takeaways
- The field of topology studies the mapping of one space into another through continuous deformations.
- Machine learning algorithms produce functional mappings from an input space to an output space and lend themselves to be understood using the formalisms of topology.
- A topological approach allows you to study data sets without assuming a shape beforehand and to combine various machine learning techniques while maintaining guarantees about the underlying shape of the data.
David Beyer: Let’s get started by talking about your background and how you got to where you are today.
Gurjeet Singh: I am a mathematician and a computer scientist, originally from India. I got my start in the field at Texas Instruments, building integrated software and performing digital design. While at TI, I got to work on a project using clusters of specialized chips called Digital Signal Processors (DSPs) to solve computationally hard math problems.
As an engineer by training, I had a visceral fear of advanced math. I didn’t want to be found out as a fake, so I enrolled in the Computational Math program at Stanford. There, I was able to apply some of my DSP work to solving partial differential equations and demonstrate that a fluid dynamics researcher need not buy a supercomputer anymore; they could just employ a cluster of DSPs to run the system. I then spent some time in mechanical engineering building similar GPU-based partial differential equation solvers for mechanical systems. Finally, I worked in Andrew Ng’s lab at Stanford, building a quadruped robot and programming it to learn to walk by itself. Read more…

6 reasons why I like KeystoneML
The O'Reilly Data Show Podcast: Ben Recht on optimization, compressed sensing, and large-scale machine learning pipelines.

As we put the finishing touches on what promises to be another outstanding Hardcore Data Science Day at Strata + Hadoop World in New York, I sat down with my co-organizer Ben Recht for the the latest episode of the O’Reilly Data Show Podcast. Recht is a UC Berkeley faculty member and member of AMPLab, and his research spans many areas of interest to data scientists including optimization, compressed sensing, statistics, and machine learning.
At the 2014 Strata + Hadoop World in NYC, Recht gave an overview of a nascent AMPLab research initiative into machine learning pipelines. The research team behind the project recently released an alpha version of a new software framework called KeystoneML, which gives developers a chance to test out some of the ideas that Recht outlined in his talk last year. We devoted a portion of this Data Show episode to machine learning pipelines in general, and a discussion of KeystoneML in particular.
Since its release in May, I’ve had a chance to play around with KeystoneML and while it’s quite new, there are several things I already like about it:
KeystoneML opens up new data types
Most data scientists don’t normally play around with images or audio files. KeystoneML ships with easy to use sample pipelines for computer vision and speech. As more data loaders get created, KeystoneML will enable data scientists to leverage many more new data types and tackle new problems. Read more…

The key to agile data science: experimentation
A real-world example of how a short delivery cycle fosters creativity.
 I lead a research team of data scientists responsible for discovering insights that lead to market and competitive intelligence for our company, Computer Sciences Corporation (CSC). We are a busy group. We get questions from all different areas of the company and it’s important to be agile.
The nature of data science is experimental. You don’t know the answer to the question asked of you — or even if an answer exists. You don’t know how long it will take to produce a result or how much data you need. The easiest approach is to just come up with an idea and work on it until you have something. But for those of us with deadlines and expectations, that approach doesn’t fly. Companies that issue you regular paychecks usually want insight into your progress.
This is where being agile matters. An agile data scientist works in small iterations, pivots based on results, and learns along the way. Being agile doesn’t guarantee that an idea will succeed, but it does decrease the amount of time it takes to spot a dead end. Agile data science lets you deliver results on a regular basis and it keeps stakeholders engaged.
The key to agile data science is delivering data products in defined time boxes — say, two- to three-week sprints. Short delivery cycles force us to be creative and break our research into small chunks that can be tested using minimum viable experiments. We deliver something tangible after almost every sprint for our stakeholders to review and give us feedback. Our stakeholders get better visibility into our work, and we learn early on if we are on track.
This approach might sound obvious, but it isn’t always natural for the team. We have to get used to working on just enough to meet stakeholder’s needs and resist the urge to make solutions perfect before moving on. After we make something work in one sprint, we make it better in the next only if we can find a really good reason to do so. Read more…

The truth about MapReduce performance on SSDs
Cost-per-performance is approaching parity with HDDs.

Karthik Kambatla co-authored this post.
It is well-known that solid-state drives (SSDs) are fast and expensive. But exactly how much faster — and more expensive — are they than the hard disk drives (HDDs) they’re supposed to replace? And does anything change for big data?
I work on the performance engineering team at Cloudera, a data management vendor. It is my job to understand performance implications across customers and across evolving technology trends. The convergence of SSDs and big data does have the potential to broadly impact future data center architectures. When one of our hardware partners loaned us a number of SSDs with the mandate to “find something interesting,” we jumped on the opportunity. This post shares our findings.
As a starting point, we decided to focus on MapReduce. We chose MapReduce because it enjoys wide deployment across many industry verticals — even as other big data frameworks such as SQL-on-Hadoop, free text search, machine learning, and NoSQL gain prominence.
We considered two scenarios: first, when setting up a new cluster, we explored whether SSDs or HDDs, of equal aggregate bandwidth, are superior; second, we explored how cluster operators should configure SSDs, when upgrading an HDDs-only cluster. Read more…

Building intelligent machines
To understand deep learning, let’s start simple.

Use code DATA50 to get 50% off of the new early release of “Fundamentals of Deep Learning: Designing Next-Generation Artificial Intelligence Algorithms.” Editor’s note: This is an excerpt of “Fundamentals of Deep Learning,” by Nikhil Buduma.
The brain is the most incredible organ in the human body. It dictates the way we perceive every sight, sound, smell, taste, and touch. It enables us to store memories, experience emotions, and even dream. Without it, we would be primitive organisms, incapable of anything other than the simplest of reflexes. The brain is, inherently, what makes us intelligent.
The infant brain only weighs a single pound, but somehow, it solves problems that even our biggest, most powerful supercomputers find impossible. Within a matter of days after birth, infants can recognize the faces of their parents, discern discrete objects from their backgrounds, and even tell apart voices. Within a year, they’ve already developed an intuition for natural physics, can track objects even when they become partially or completely blocked, and can associate sounds with specific meanings. And by early childhood, they have a sophisticated understanding of grammar and thousands of words in their vocabularies.
For decades, we’ve dreamed of building intelligent machines with brains like ours — robotic assistants to clean our homes, cars that drive themselves, microscopes that automatically detect diseases. But building these artificially intelligent machines requires us to solve some of the most complex computational problems we have ever grappled with, problems that our brains can already solve in a manner of microseconds. To tackle these problems, we’ll have to develop a radically different way of programming a computer using techniques largely developed over the past decade. This is an extremely active field of artificial computer intelligence often referred to as deep learning. Read more…

Data modeling with multi-model databases
A case study for mixing different data models within the same data store.
Editor’s note: Full disclosure — the author is a developer and software architect at ArangoDB GmbH, which leads the development of the open source multi-model database ArangoDB.
In recent years, the idea of “polyglot persistence” has emerged and become popular — for example, see Martin Fowler’s excellent blog post. Fowler’s basic idea can be interpreted that it is beneficial to use a variety of appropriate data models for different parts of the persistence layer of larger software architectures. According to this, one would, for example, use a relational database to persist structured, tabular data; a document store for unstructured, object-like data; a key/value store for a hash table; and a graph database for highly linked referential data. Traditionally, this means that one has to use multiple databases in the same project, which leads to some operational friction (more complicated deployment, more frequent upgrades) as well as data consistency and duplication issues.
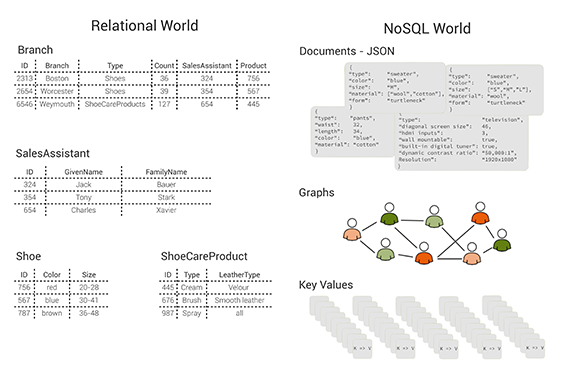
Figure 1: tables, documents, graphs and key/value pairs: different data models. Image courtesy of Max Neunhöffer.
This is the calamity that a multi-model database addresses. You can solve this problem by using a multi-model database that consists of a document store (JSON documents), a key/value store, and a graph database, all in one database engine and with a unifying query language and API that cover all three data models and even allow for mixing them in a single query. Without getting into too much technical detail, these three data models are specially chosen because an architecture like this can successfully compete with more specialised solutions on their own turf, both with respect to query performance and memory usage. The column-oriented data model has, for example, been left out intentionally. Nevertheless, this combination allows you — to a certain extent — to follow the polyglot persistence approach without the need for multiple data stores. Read more…

Real-time analytics within the transaction
Integrated data stream platforms are poised to supplant the lambda architecture.

Data generation is growing exponentially, as is the demand for real-time analytics over fast input data. Traditional approaches to analyzing data in batch mode overcome the computational problems of data volume by scaling horizontally using a distributed system like Apache Hadoop. However, this solution is not feasible for analyzing large data streams in real time due to the scheduling I/O overhead it introduces.
Two main problems occur when batch processing is applied to stream or fast data. First, by the time the analysis is complete, it may already have been outdated by new incoming data. Second, the data may be arriving so fast that it is not feasible to store and batch-process them later, so the data must be processed or summarized when it is received. The Square Kilometer Array (SKA) radio telescope is a good public example of a system in which data must be preprocessed before storage. The SKA is a distributed radio observation project where each base station will receive 10-30 TB/sec and the Central Unit will process 4PB/sec. In this scenario, online summaries of the input data must be computed in real time and then processed — and significantly reduced in size — data is what’s stored.
In the business world, common examples of stream data are sensor networks, Twitter, Internet traffic, logs, financial tickers, click streams, and online bids. Algorithmic solutions enable the computation of summaries, frequency (heavy hitter) and event detection, and other statistical calculations on the stream as a whole or detection of outliers within it.
But what if you need to perform transaction-level analysis — scans across different dimensions of the data set, for example — as well as store the streamed data for fast lookup and retrospective analysis? Read more…

Unpacking technical jargon in machine learning
A new report explores how to evaluate your machine learning models.

Get notified when our free report “Evaluating Machine Learning Models: A beginner’s guide to key concepts and pitfalls” is available for download. Editor’s note: This is an excerpt of “Evaluating Machine Learning Models,” by Alice Zheng.
Alice Zheng will be part of the Data Science Summit and Dato Conference in July — a non-profit event jointly organized by Intel, Comcast, Pandora, Dato, Cloudera, and O’Reilly Media — in San Francisco. Visit the conference website for more information on the program. Use the discount code OREILLY20 and get 20% off either one or both days of the conference.
This report on evaluating machine learning models arose out of a sense of need. The content was first published as a series of six technical posts on the Dato Machine Learning Blog. I was the editor of the blog, and I needed something to publish for the next day. Dato builds machine learning tools that help users build intelligent data products. In our conversations with the community, we sometimes ran into a confusion in terminology. For example, people would ask for cross validation as a feature, when what they really meant was hyperparameter tuning, a feature we already had. So, I thought, “Aha! I’ll just quickly explain what these concepts mean and point folks to the relevant sections in the user guide.”
I sat down to write a blog post to explain cross validation, hold-out data sets, and hyperparameter tuning. After the first two paragraphs, however, I realized that it would take a lot more than a single blog post. The three terms sit at different depths in the concept hierarchy of machine learning model evaluation. Cross validation and hold-out validation are ways of chopping up a data set in order to measure the model’s performance on “unseen” data. Hyperparameter tuning, on the other hand, is a more “meta” process of model selection. But why does the model need “unseen” data, and what’s meta about hyperparameters? In order to explain all of that, I needed to start from the basics. First, I needed to explain the high-level concepts and how they fit together. Only then could I dive into each one in detail. Read more…

The original big data industry
Oil and gas exploration have long been at the forefront of data collection and analysis.
Download our new free report, “Oil, Gas, and Data: High-Performance Data Tools in the Production of Industrial Power,” looking at the role of data, machine learning, and predictive analytics in oil and gas exploration.
Petroleum extraction is an industry marked by price volatility and high capital exposure in new ventures. Big data is reducing risk, not just to capital, but to workers and the environment as well, as Dan Cowles explores in the new free report Oil, Gas, and Data.
At the Global Petroleum Show in Calgary, exhibiting alongside massive drill heads, chemical analysts, and the latest in valves and pipes are companies with a decidedly more virtual product: data. IBM’s Aspera, Abacus Datagraphics, Fujitsu, and Oracle’s Front Porch Digital are pitching data intake, analysis, and storage services to the oil industry, and industry stalwarts such as Halliburton, Lockheed Martin, and BP have been developing these capacities in-house.
The primary benefits of big data occur at the upstream end of petroleum production: exploration, discovery, and drilling. Better analysis of seismic and other geological data allows for drilling in more productive locations, and continual monitoring of equipment results in more uptime and better safety for both workers and environment. These marginal gains can be enough to keep an entire region competitive: the trio of cheap sensors, fast networks, and distributed computation that we’ve so often seen in other industries is the difference-maker keeping the North Sea oilfields productive in sub-$100/barrel market. Read more…
Why data preparation frameworks rely on human-in-the-loop systems
The O'Reilly Data Show Podcast: Ihab Ilyas on building data wrangling and data enrichment tools in academia and industry.

As I’ve written in previous posts, data preparation and data enrichment are exciting areas for entrepreneurs, investors, and researchers. Startups like Trifacta, Tamr, Paxata, Alteryx, and CrowdFlower continue to innovate and attract enterprise customers. I’ve also noticed that companies — that don’t specialize in these areas — are increasingly eager to highlight data preparation capabilities in their products and services.
During a recent episode of the O’Reilly Data Show Podcast, I spoke with Ihab Ilyas, professor at the University of Waterloo and co-founder of Tamr. We discussed how he started working on data cleaning tools, academic database research, and training computer science students for positions in industry.
Academic database research in data preparation
Given the importance of data integrity, it’s no surprise that the database research community has long been interested in data preparation and data wrangling. Ilyas explained how his work in probabilistic databases led to research projects in data cleaning:
In the database theory community, these problems of handling, dealing with data inconsistency, and consistent query answering have been a celebrated area of research. However, it has been also difficult to communicate these results to industry. And database practitioners, if you like, they were more into the well-structured data and assuming a lot of good properties around this data, [and they were also] more interested in indexing this data, storing it, moving it from one place to another. And now, dealing with this large amount of diverse heterogeneous data with tons of errors, sidled across all business units in the same enterprise became a necessity. You cannot really avoid that anymore. And that triggered a new line of research for pragmatic ways of doing data cleaning and integration. … The acquisition layer in that stack has to deal with large sets of formats and sources. And you will hear about things like adapters and source adapters. And it became a market on its own, how to get access and tap into these sources, because these are kind of the long tail of data.
…
The way I came into this subject was also funny because we were talking about the subject called probabilistic databases and how to deal with data uncertainty. And that morphed into trying to find data sets that have uncertainty. And then we were shocked by how dirty the data is and how data cleaning is a task that’s worth looking at.