"strata sc 2014 sessions" entries

Bridging the divide between big data and (big) algorithms
Strata SC 2014 Session Postmortem
In February, GraphLab took a road trip to Strata, a Big Data conference organized by O’Reilly. It was a gathering of close to 3100 people–engineers, business folks, industry evangelists, and data scientists. We had a lot of fun meeting and socializing with our peers and customers. Amidst all the conference excitement, we presented two talks. Carlos Guestrin, our intrepid CEO, held a tutorial on large-scale machine learning. I gave a talk in the Hardcore Data Science track.
Emotional AI: The human side of machine learning
Insight from a Strata Santa Clara 2014 session
When you think about what goes into winning a Nobel Prize in a field like economics, it’s a lot like machine learning. In order to make a breakthrough, you need to identify an interesting theory for explaining the world, test your theory in practice to see if it holds up, and if it does, you’ve got a potential winner. The bigger and more significant the issue addressed by your theory, the more likely you are to win the prize.
In the world of business, there’s no bigger issue than helping a company be more successful, and that usually hinges on helping it deliver its products to those that need them. This is why I like to describe my company SalesPredict as helping our customers win the Nobel Prize in business, if such a thing existed.
Machine Data at Strata: “BigData++”
By David Andrzejewski of SumoLogic

Photo Courtesy of David Andrzejewski
A few weeks ago I had the pleasure of hosting the machine data track of talks at Strata Santa Clara. Like “big data”, the phrase “machine data” is associated with multiple (sometimes conflicting) definitions, two prominent ones come from Curt Monash and Daniel Abadi. The focus of the machine data track is on data which is generated and/or collected automatically by machines. This includes software logs and sensor measurements from systems as varied as mobile phones, airplane engines, and data centers. The concept is closely related to the “internet of things”, which refers to the trend of increasing connectivity and instrumentation in existing devices, like home thermostats.
More data, more problems
This data can be useful for the early detection of operational problems or the discovery of opportunities for improved efficiency. However, the decoupling of data generation and collection from human action means that the volume of machine data can grow at machine scales (i.e., Moore’s Law), an issue raised by both Monash and Abadi. This explosive growth rate amplifies existing challenges associated with “big data”. In particular two common motifs among the talks at Strata were the difficulties around:
- mechanics: the technical details of data collection, storage, and analysis
- semantics: extracting understandable and actionable information from the data deluge

Bridging the gap between research and implementation
Hardcore Data Science speakers provided many practical suggestions and tips
One of the most popular offerings at Strata Santa Clara was Hardcore Data Science day. Over the next few weeks we hope to profile some of the speakers who presented, and make the video of the talks available as a bundle. In the meantime here are some notes and highlights from a day packed with great talks.
Data Structures
We’ve come to think of analytics as being comprised primarily of data and algorithms. Once data has been collected, “wrangled”, and stored, algorithms are unleashed to unlock its value. Longtime machine-learning researcher Alice Zheng of GraphLab, reminded attendees that data structures are critical to scaling machine-learning algorithms. Unfortunately there is a disconnect between machine-learning research and implementation (so much so, that some recent advances in large-scale ML are “rediscoveries” of known data structures):

While there are many data structures that arise in computer science, Alice devoted her talk to two data structures1 that are widely used in machine-learning:
How might we …
Human-centered design techniques from an ideation workshop.
By Bo Peng and Aaron Wolf of Datascope Analytics

Bo Peng at a Datascope Analytics Ideation Workshop in Chicago
At Datascope Analytics, our ideation workshop combines elements from human-centered design principles to develop innovative and valuable ideas/solutions/strategies for our clients. From our workshop experience, we’ve developed a few key techniques that have enabled successful communication and collaboration. We complete certain milestones during the workshop: the departure point, the dream view, and curation with gold star voting, among others. These are just a few of the accomplishments that are achieved at various points during the workshop. In addition, we strive to support cultural goals throughout the workshop’s duration: creating an environment that spurs creativity and encourages wild ideas, and maintaining a mediator role. These techniques have thus far proven successful in providing innovative and actionable solutions for our clients.
Business analysts want access to advanced analytics
Business users are starting to tackle problems that require machine-learning and statistics
I talk with many new companies who build tools for business analysts and other non-technical users. These new tools streamline and simplify important data tasks including interactive analysis (e.g., pivot tables and cohort analysis), interactive visual analysis (as popularized by Tableau and Qlikview), and more recently data preparation. Some of the newer tools scale to large data sets, while others explicitly target small to medium-sized data.
As I noted in a recent post, companies are beginning to build data analysis tools1 that target non-experts. Companies are betting that as business users start interacting with data, they will want to tackle some problems that require advanced analytics. With business analysts far outnumbering data scientists, it makes sense to offload some problems to non-experts2.
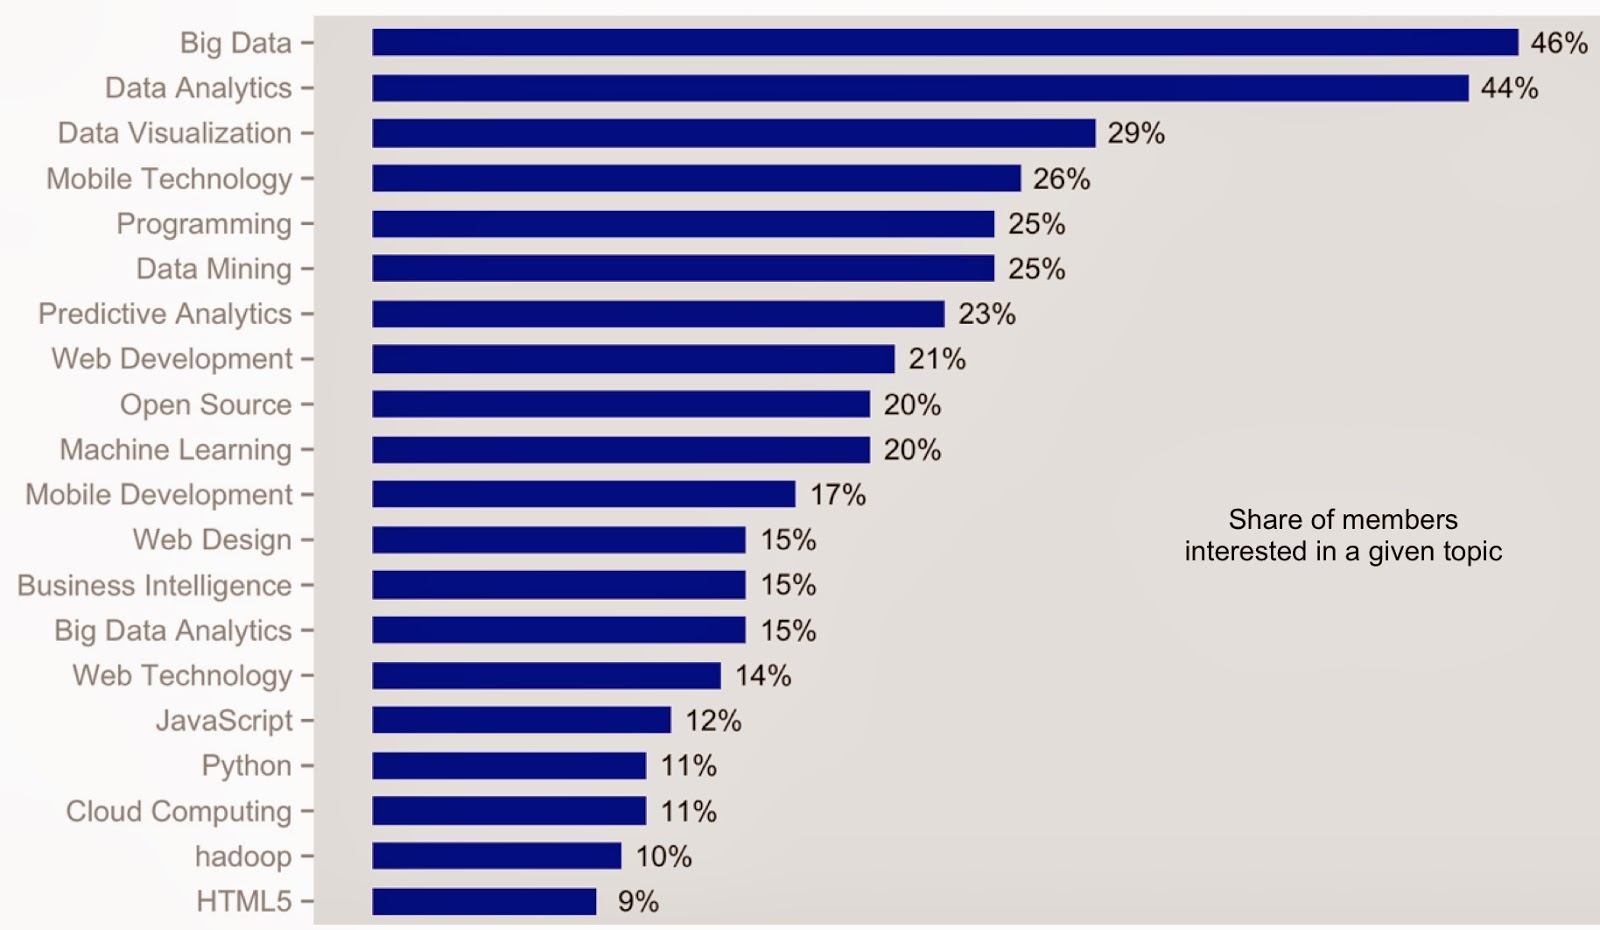
Moreover data seems to support the notion that business users are interested in more complex problems. I recently looked at data3 from 11 large Meetups (in NYC and the SF Bay Area) that target business analysts and business intelligence users. Altogether these Meetups had close to 5,000 active4 members. As you can see in the chart below, business users are interested in topics like machine learning (1 in 5), predictive analytics (1 in 4), and data mining (1 in 4):
What I use for data visualization
An array of tools for tackling data visualizations.
Depending on the nature of the problem, data size, and deliverable, I still draw upon an array of tools for data visualization. As I survey the Design track at next month’s Strata conference, I see creators and power users of visualization tools that many data scientists have come to rely on. Several pioneers will lead sessions on (new) tools for creating static and interactive charts, against small and massive data sets.
The Grammar of Graphics
To this day, I find R (specifically ggplot2) to be a tool I turn to for producing static visualizations. Even the simplest charts allow me to quickly spot data problems and anomalies, and a tool like ggplot2 can accomplish a lot in very few lines of code. Charts produced by ggplot2 look much nicer than simple R plots and once you get past the initial learning curve, they are easy to fine-tune and customize.
Hadley Wickham1, the creator of ggplot2, is speaking on two new domain specific languages (ggvis and dplyr) that make it easy for R users to declaratively create interactive web graphics. As Hadley describes it, ggvis is interactive Grammar of Graphics for R. As more data scientists turn to interactive visualizations that can be shared through web browsers, ggvis is the natural next tool for ggplot2 users.
Leland Wilkinson, the primary author of The Grammar of Graphics2, will also be at Strata to lead a tutorial on an interesting expert system that lets machine-learning techniques be accessible to business users. Leland’s work has influenced many other visualization tools including Polaris (from the Stanford team that founded Tableau), Bokeh, and ggbio (for genomics data). Effective visualization techniques will be an important component of his Strata tutorial.
IPython: A unified environment for interactive data analysis
It has roots in academic scientific computing, but has features that appeal to many data scientists
As I noted in a recent post on reproducing data projects, notebooks have become popular tools for maintaining, sharing, and replicating long data science workflows. Much of that is due to the popularity of IPython1. In development since 2001, IPython grew out of the scientific computing community and has slowly added features that appeal to data scientists.
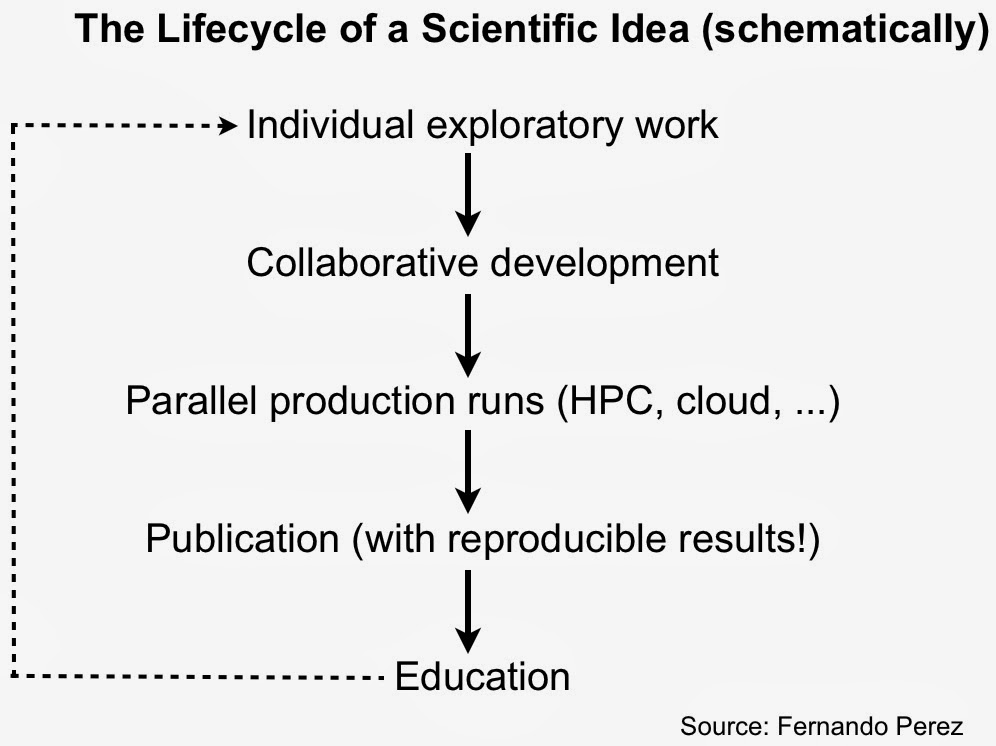
Roots in academic scientific computing
As IPython creator Fernando Perez noted in his “historical retrospective”, exploratory analysis in a scientific setting requires a solid interactive environment. After years of development IPython has become a great tool for interacting with data. IPython also addresses other important pain points for scientists – reproducibility and collaboration – issues that are equally important to data scientists working in industry.
IPython is more than just Python
With an interactive widget architecture that’s 100% language-agnostic, these days IPython is used by many other programming language communities2, including Julia, Haskell, F#, Ruby, Go, and Scala. If you’re a data scientist who likes to mix-and-match languages, you can create, maintain, and share multi-language data projects in IPython:
Why is building custom recommender systems hard? Does it have to be?

Photo Courtesy of Carlos Guestrin
Today, it’s shocking (and honestly exciting) how much of my daily experience is determined by a recommender system. These systems drive amazing experiences everywhere, telling me where to eat, what to listen to, what to watch, what to read, and even who I should be friends with. Furthermore, information overload is making recommender systems indispensable, since I can’t find what I want on the web simply using keyword search tools. Recommenders are behind the success of industry leaders like Netflix, Google, Pandora, eHarmony, Facebook, and Amazon. It’s no surprise companies want to integrate recommender systems with their own online experiences. However, as I talk to team after team of smart industry engineers, it has become clear that building and managing these systems is usually a bit out of reach, especially given all the other demands on the team’s time.

Learning Apache Mesos
In the summer of 2012, Accel Partners hosted an invitation-only Big Data conference at Stanford. Ping Li stood near the exit with a checkbook, ready to invest $1MM in pitches for real-time analytics on clusters. However, real-time means many different things. For MetaScale working on the Sears turnaround, real-time means shrinking a 6 hour window on a mainframe to 6 minutes on Hadoop. For a hedge fund, real-time means compiling Python to run on GPUs where milliseconds matter, or running on FPGA hardware for microsecond response.
With much emphasis on Hadoop circa 2012, one might think that no other clusters existed. Nothing could be further from the truth: Memcached, Ruby on Rails, Cassandra, Anaconda, Redis, Node.js, etc. – all in large-scale production use for mission critical apps, much closer to revenue than the batch jobs. Google emphasizes a related point in their Omega paper: scheduling batch jobs is not difficult, while scheduling services on a cluster is a hard problem, and that translates to lots of money.