"spark" entries

Data Scientists and Data Engineers like Python and Scala
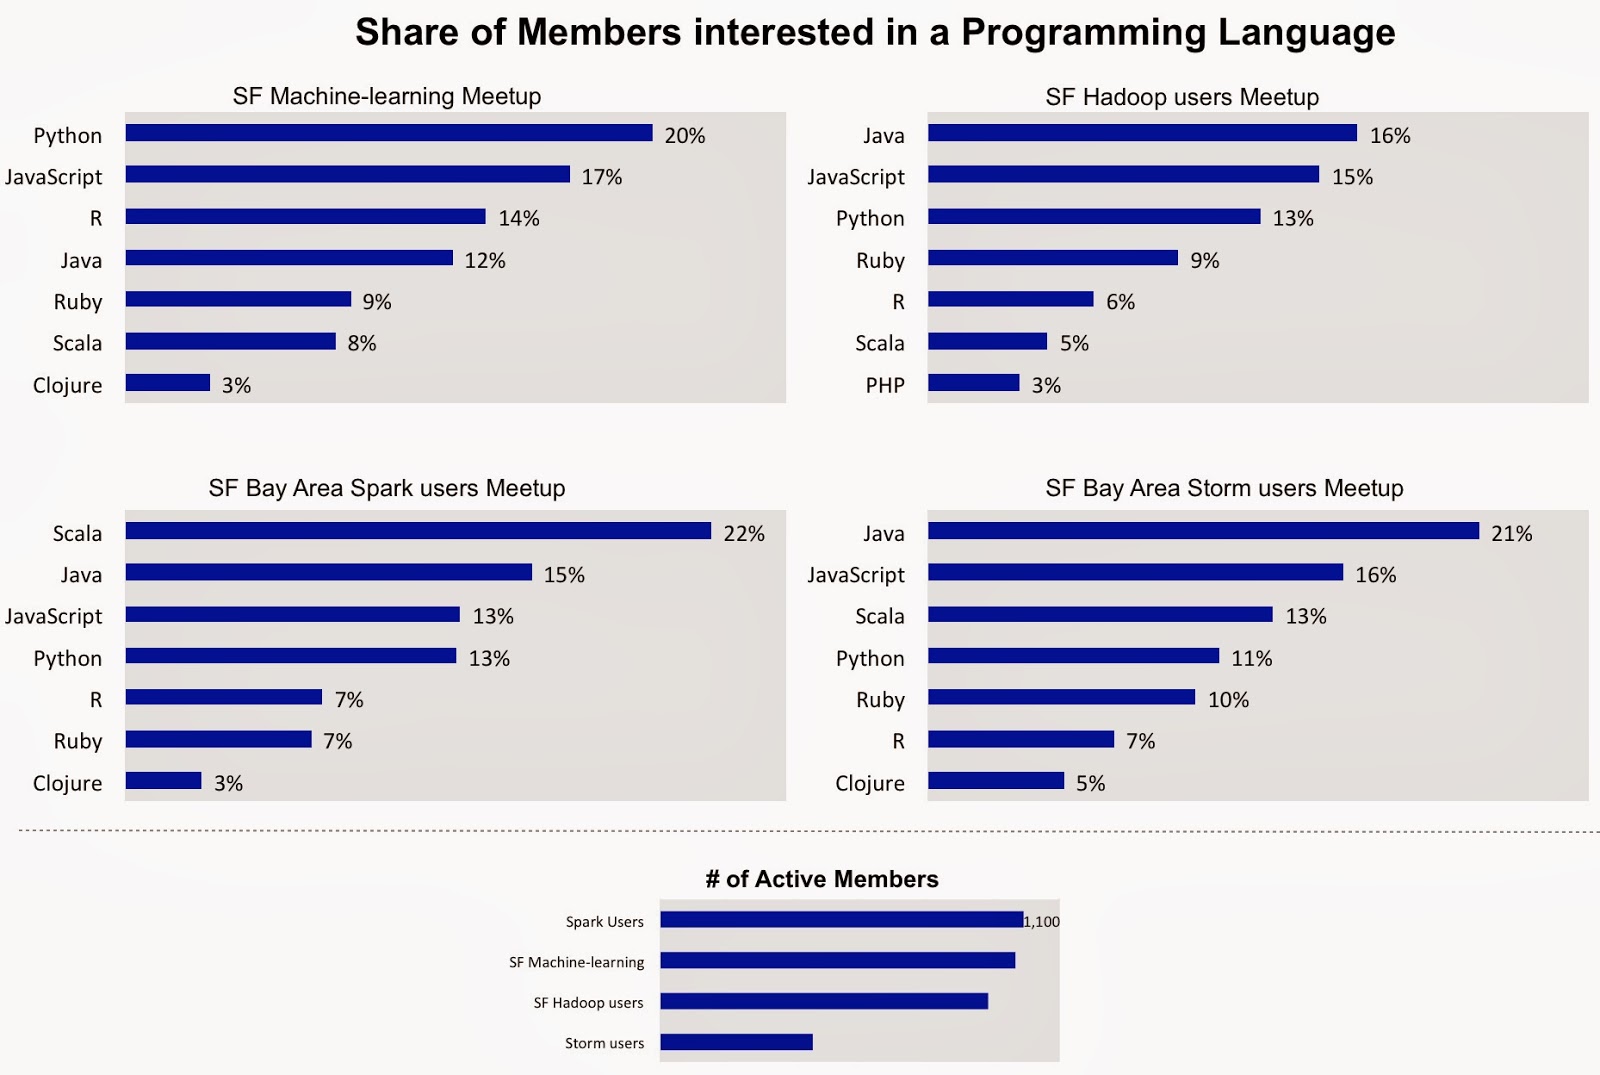
Python and Scala are popular among members of several well-attended SF Bay Area Meetups
In exchange for getting personalized recommendations many Meetup members declare1 topics that they’re interested in. I recently looked at the topics listed by members of a few local, data Meetups that I’ve frequented. These Meetups vary in size from 600 to 2,000 total (and 400 to 1,100 active2) members.
I was particularly interested in the programming languages members expressed interest in. What I found3 confirmed trends that we’ve noticed in other data sets (online job postings): Python has surpassed R among data scientists and data engineers, Scala is second to Java among JVM languages, and many folks are interested in Javascript. As pydata tools mature, I’ve encountered people who have shifted more of their data workflow from R over to Python.

Behind the Scenes of the First Spark Summit
How it All Started
Spark is a popular open source cluster computing engine for Big Data analytics and a central component of the Berkeley Data Analytics Stack (BDAS). It started as a research project in the UC Berkeley AMPLab and was developed with a focus on attracting production users as well as a diverse community of open source contributors. A community quickly began to grow around Spark, even as a young project in the AMPLab. Before long, this community began gathering at monthly meetups and using mailing lists to discuss development efforts and share their experiences using Spark. More recently the project entered the Apache Incubator.
This year, the core Spark team spun out of the AMPLab to found Databricks, a startup that is using Spark to build next-generation software for analyzing and extracting value from data. At Databricks, we are dedicated to the success of the Spark project and are excited to see the community growing rapidly. This growth demonstrates the need for a larger event that brings the entire community together beyond the meetups. Thus we began planning the first Spark Summit. The Summit will be structured like a super-sized meetup. Meetups typically consist of a single talk, a single sponsor, and dozens of attendees, whereas the Summit will consist of 30 talks, 18 sponsors, hundreds of attendees, and a full day of training exercises.
We understand that an open source project is only as successful as its underlying community. Therefore, we want the Summit to be a community driven event.
Behind the Scenes with the Summit Ops and the Program Committee
The first thing we did was bring in a third-party event producer with a track record of creating high quality open source community events. By separating out the event production we allowed all of the community leaders to share ownership of the technical portion of the event. For example, instead of inviting speakers directly, we hosted an open call for talk submissions. Then we assembled a Program Committee consisting of representatives from 12 of the leading organizations in the Spark community. Finally, the PC members voted on all of the talk submissions to decide the final summit agenda.
The event has been funded by assembling a sponsor network consisting of organizations within the community. With sponsors that are driving the development of the platform, the summit will be an environment that facilitates connections between developers with Spark skills and organizations searching for such developers. We decided that Databricks would participate in the Summit as a peer in this sponsor network.
How companies are using Spark
The inaugural Spark Summit will feature a wide variety of real-world applications
When an interesting piece of big data technology gets introduced, early1 adopters tend to focus on technical features and capabilities. Applications get built as companies develop confidence that it’s reliable and that it really scales to large data volumes. That seems to be where Spark is today. With over 90 contributors from 25 companies, it has one of the largest developer communities among big data projects (second only to Hadoop MapReduce).

I recently became an advisor to Databricks (a startup commercializing Spark) and a member of the program committee for the inaugural Spark Summit. As I pored over submissions to Spark’s first community gathering, I learned how companies have come to rely on Spark, Shark, and other components of the Berkeley Data Analytics Stack (BDAS). Spark is at that stage where companies are deploying it, and the upcoming Spark Summit in San Francisco will showcase many real-world applications. These applications cut across many domains including advertising, marketing, finance, and academic/scientific research, but can generally be grouped into the following categories:
Data processing workflows: ETL and Data Wrangling
Many companies rely on a wide variety of data sources for their analytic products. That means cleaning, transforming, and fusing (unstructured) external data with internal data sources. Many companies – particularly startups – use Spark for these types of data processing workflows. There are even companies that have created simple user interfaces that open up batch data processing tasks to non-programmers.
Databricks aims to build next-generation analytic tools for Big Data
A new startup will accelerate the maturation of the Berkeley Data Analytics Stack
Key technologists behind the Berkeley Data Analytics Stack (BDAS) have launched a company that will build software – centered around Apache Spark and Shark – for analyzing big data. Details of their product and strategy are sparse, as the company is operating in stealth mode. But through conversations with the founders of Databricks, I’ve learned that they’ll be building general purpose analytic tools that can leverage HDFS, YARN, as well as other components of BDAS.
It will be interesting to see how the team transitions to the corporate world. Their Series A funding round of $14M is being led by Andreessen Horowitz. The board will be composed of Ben Horowitz, Scott Shenker, Matei Zaharia, and Ion Stoica.
Data analysis tools target non-experts
Tools simplify the application of advanced analytics and the interpretation of results
A new set of tools make it easier to do a variety of data analysis tasks. Some require no programming, while other tools make it easier to combine code, visuals, and text in the same workflow. They enable users who aren’t statisticians or data geeks, to do data analysis. While most of the focus is on enabling the application of analytics to data sets, some tools also help users with the often tricky task of interpreting results. In the process users are able to discern patterns and evaluate the value of data sources by themselves, and only call upon expert1 data analysts when faced with non-routine problems.
Visual Analysis and Simple Statistics
Three SaaS startups – DataHero, DataCracker, Statwing – make it easy to perform simple data wrangling, visual analysis, and statistical analysis. All three (particularly DataCracker) appeal to users who analyze consumer surveys. Statwing and DataHero simplify the creation of Pivot Tables2 and suggest3 charts that work well with your data. StatWing users are also able to execute and view the results of a few standard statistical tests in plain English (detailed statistical outputs are also available).
Statistics and Machine-learning
BigML and Datameer’s Smart Analytics are examples of recent tools that make it easy for business users to apply machine-learning algorithms to data sets (massive data sets, in the case of Datameer). It makes sense to offload routine data analysis tasks to business analysts and I expect other vendors such as Platfora and ClearStory to provide similar capabilities in the near future.
Moving from Batch to Continuous Computing at Yahoo!
Spark, Storm, HBase, and YARN power large-scale, real-time models.
My favorite session at the recent Hadoop Summit was a keynote by Bruno Fernandez-Ruiz, Senior Fellow & VP Platforms at Yahoo! He gave a nice overview of their analytic and data processing stack, and shared some interesting factoids about the scale of their big data systems. Notably many of their production systems now run on MapReduce 2.0 (MRv2) or YARN – a resource manager that lets multiple frameworks share the same cluster.
Yahoo! was the first company to embrace Hadoop in a big way, and it remains a trendsetter within the Hadoop ecosystem. In the early days the company used Hadoop for large-scale batch processing (the key example being, computing their web index for search). More recently, many of its big data models require low latency alternatives to Hadoop MapReduce. In particular, Yahoo! leverages user and event data to power its targeting, personalization, and other “real-time” analytic systems. Continuous Computing is a term Yahoo! uses to refer to systems that perform computations over small batches of data (over short time windows), in between traditional batch computations that still use Hadoop MapReduce. The goal is to be able to quickly move from raw data, to information, to knowledge:

On a side note: many organizations are beginning to use cluster managers that let multiple frameworks share the same cluster. In particular I’m seeing many companies – notably Twitter – use Mesos1 (instead of YARN) to run similar services (Storm, Spark, Hadoop MapReduce, HBase) on the same cluster.
Going back to Bruno’s presentation, here are some interesting bits – current big data systems at Yahoo! by the numbers:
Improving options for unlocking your graph data
Graph data is an area that has attracted many enthusiastic entrepreneurs and developers
The popular open source project GraphLab received a major boost early this week when a new company comprised of its founding developers, raised funding to develop analytic tools for graph data sets. GraphLab Inc. will continue to use the open source GraphLab to “push the limits of graph computation and develop new ideas”, but having a commercial company will accelerate development, and allow the hiring of resources dedicated to improving usability and documentation.
While social media placed graph data on the radar of many companies, similar data sets can be found in many domains including the life and health sciences, security, and financial services. Graph data is different enough that it necessitates special tools and techniques. Because tools were a bit too complex for casual users, in the past this meant graph data analytics was the province of specialists. Fortunately graph data is an area that has attracted many enthusiastic entrepreneurs and developers. The tools have improved and I expect things to get much easier for users in the future. A great place to learn more about tools for graph data, is at the upcoming GraphLab Workshop (on July 1st in SF).
Data wrangling: creating graphs
Before you can take advantage of the other tools mentioned in this post, you’ll need to turn your data (e.g., web pages) into graphs. GraphBuilder is an open source project from Intel, that uses Hadoop MapReduce1 to build graphs out of large data sets. Another option is the combination of GraphX/Spark described below. (A startup called Trifacta is building a general-purpose, data wrangling tool, that could help as well. )
Tachyon: An open source, distributed, fault-tolerant, in-memory file system
Tachyon enables data sharing across frameworks and performs operations at memory speed
In earlier posts I’ve written about how Spark and Shark run much faster than Hadoop and Hive by1 caching data sets in-memory. But suppose one wants to share datasets across jobs/frameworks, while retaining speed gains garnered by being in-memory? An example would be performing computations using Spark, saving it, and accessing the saved results in Hadoop MapReduce. An in-memory storage system would speed up sharing across jobs by allowing users to save at near memory speeds. In particular the main challenge is being able to do memory-speed “writes” while maintaining fault-tolerance.
In-memory storage system from UC Berkeley’s AMPLab
The team behind the BDAS stack recently released a developer preview of Tachyon – an in-memory, distributed, file system. The current version of Tachyon was written in Java and supports Spark, Shark, and Hadoop MapReduce. Working data sets can be loaded into Tachyon where they can be accessed at memory speed, by many concurrent users. Tachyon implements the Hadoop FileSystem interface for standard file operations (such as create, open, read, write, close, and delete).

Four steps to analyzing big data with Spark
By Andy Konwinski, Ion Stoica, and Matei Zaharia
In the UC Berkeley AMPLab, we have embarked on a six year project to build a powerful next generation big data analytics platform: the Berkeley Data Analytics Stack (BDAS). We have already released several components of BDAS including Spark, a fast distributed in-memory analytics engine, and in February we ran a sold out tutorial at the Strata conference in Santa Clara teaching attendees how to use Spark and other components of the BDAS stack.
In this blog post we will walk through four steps to getting hands-on using Spark to analyze real data. For an overview of the motivation and key components of BDAS, check out our previous Strata blog post.
Data Science tools: Are you “all in” or do you “mix and match”?
It helps to reduce context-switching during long data science workflows.
An integrated data stack boosts productivity
As I noted in my previous post, Python programmers willing to go “all in”, have Python tools to cover most of data science. Lest I be accused of oversimplification, a Python programmer still needs to commit to learning a non-trivial set of tools1. I suspect that once they invest the time to learn the Python data stack, they tend to stick with it unless they absolutely have to use something else. But being able to stick with the same programming language and environment is a definite productivity boost. It requires less “setup time” in order to explore data using different techniques (viz, stats, ML).
Multiple tools and languages can impede reproducibility and flow
On the other end of the spectrum are data scientists who mix and match tools, and use packages and frameworks from several languages. Depending on the task, data scientists can avail of tools that are scalable, performant, require less2 code, and contain a lot of features. On the other hand this approach requires a lot more context-switching, and extra effort is needed to annotate long workflows. Failure to document things properly makes it tough to reproduce3 analysis projects, and impedes knowledge transfer4 within a team of data scientists. Frequent context-switching also makes it more difficult to be in a state of flow, as one has to think about implementation/package details instead of exploring data. It can be harder to discover interesting stories with your data, if you’re constantly having to think about what you’re doing. (It’s still possible, you just have to concentrate a bit harder.)