
It’s that time of year again: The public can now weigh in on the panels that have been proposed for South by Southwest (SXSW). Through September 2, SXSW is seeking input on proposals via its Panel Picker voting system. This often translates into a lot of tweets and posts where proposers ask followers to give their panels the thumbs up.
And while these social signals are one way to work through the thousands of proposals, Matt Biddulph has created another. On Google+ this week, Biddulph posted a visualization of the proposals, based in part on the tags associated with the submissions.
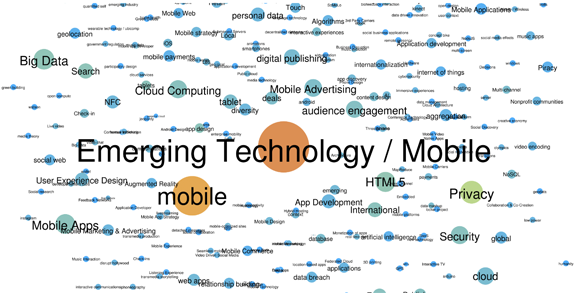
Screenshot from Matt Biddulph’s SXSW 2012 panel topics visualization. Click to see the full interactive version.
Biddulph said he’s working on a blog post about what he calls “social object graphs” — that is, visualizations and analyses based on “social objects” rather than specifically “people.” When he looked at the SXSW Panel Picker, he realized the tagging system would be interesting in this light. These tags, noted Biddulph on Google+, “can be used to make a co-occurrence graph.”
Biddulph continued:
My tool of choice once I have such a graph is Gephi, the “Photoshop of graphs.” It can perform statistical analysis, filtering and algorithmic layout, and that’s what I did to produce this SXSW viz. The nodes are sized by how “important” they are to the network. Commonly co-occurring nodes cluster close to each other, leading to a nice readable layout — if two nodes are far away, they are unrelated (e.g. UX and developer talks opposed to social media and marketing talks).
Found a great visualization? Tell us about it
This post is part of an ongoing series exploring visualizations. We’re always looking for leads, so please drop a line if there’s a visualization you think we should know about.
 Strata Conference New York 2011, being held Sept. 22-23, covers the latest and best tools and technologies for data science — from gathering, cleaning, analyzing, and storing data to communicating data intelligence effectively.
More Visualizations: