Ben Lorica

Ben Lorica is the Chief Data Scientist of O'Reilly Media, Inc. and Program Director of Strata+Hadoop World. He has applied Business Intelligence, Data Mining, Machine Learning and Statistical Analysis in a variety of settings including Direct Marketing, Consumer and Market Research, Targeted Advertising, Text Mining, and Financial Engineering. His background includes stints with an investment management company, internet startups, and financial services.
Streamlining feature engineering
Researchers and startups are building tools that enable feature discovery.
Why do data scientists spend so much time on data wrangling and data preparation? In many cases it’s because they want access to the best variables with which to build their models. These variables are known as features in machine-learning parlance. For many0 data applications, feature engineering and feature selection are just as (if not more important) than choice of algorithm:
Good features allow a simple model to beat a complex model.
(to paraphrase Alon Halevy, Peter Norvig, and Fernando Pereira)
The terminology can be a bit confusing, but to put things in context one can simplify the data science pipeline to highlight the importance of features:
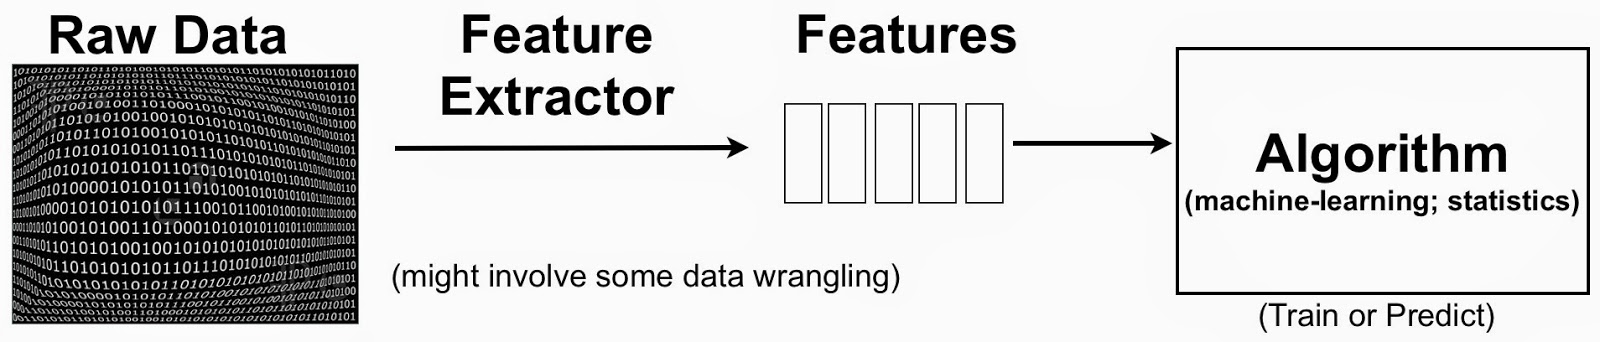
Feature Engineering or the Creation of New Features
A simple example to keep in mind is text mining. One starts with raw text (documents) and extracted features could be individual words or phrases. In this setting, a feature could indicate the frequency of a specific word or phrase. Features1 are then used to classify and cluster documents, or extract topics associated with the raw text. The process usually involves the creation2 of new features (feature engineering) and identifying the most essential ones (feature selection).
A growing number of applications are being built with Spark
Many more companies want to highlight how they're using Apache Spark in production.
One of the trends we’re following closely at Strata is the emergence of vertical applications. As components for creating large-scale data infrastructures enter their early stages of maturation, companies are focusing on solving data problems in specific industries rather than building tools from scratch. Virtually all of these components are open source and have contributors across many companies. Organizations are also sharing best practices for building big data applications, through blog posts, white papers, and presentations at conferences like Strata.
These trends are particularly apparent in a set of technologies that originated from UC Berkeley’s AMPLab: the number of companies that are using (or plan to use) Spark in production1 has exploded over the last year. The surge in popularity of the Apache Spark ecosystem stems from the maturation of its individual open source components and the growing community of users. The tight integration of high-performance tools that address different problems and workloads, coupled with a simple programming interface (in Python, Java, Scala), make Spark one of the most popular projects in big data. The charts below show the amount of active development in Spark:

For the second year in a row, I’ve had the privilege of serving on the program committee for the Spark Summit. I’d like to highlight a few areas where Apache Spark is making inroads. I’ll focus on proposals2 from companies building applications on top of Spark.
Welcome to Intelligence Matters
Casting a critical eye on the exciting developments in the world of AI.
Editor’s note: this post was co-authored by Ben Lorica and Roger Magoulas. It’s the kick-off to our Intelligence Matter series.

Siri screenshot.
True AI has been “just around the corner” for 60 years, so why should O’Reilly start covering AI in a big way now? As computing power catches up to scientific and engineering ambitions, and as our ability to learn directly from sensory signals — i.e., big data — increases, intelligent systems are having a real and widespread impact. Every Internet user benefits from these systems today — they sort our email, plan our journeys, answer our questions, and protect us from fraudsters. And, with the Internet of Things, these system have already started to keep our houses and offices comfortable and well-lit, our data centers running more efficiently, our industrial processes humming, and even are driving our cars. Read more…
Network Science dashboards
Networks graphs can be used as primary visual objects with conventional charts used to supply detailed views
With Network Science well on its way to being an established academic discipline, we’re beginning to see tools that leverage it. Applications that draw heavily from this discipline make heavy use of visual representations and come with interfaces aimed at business users. For business analysts used to consuming bar and line charts, network visualizations take some getting used. But with enough practice, and for the right set of problems, they are an effective visualization model.
In many domains, networks graphs can be the primary visual objects with conventional charts used to supply detailed views. I recently got a preview of some dashboards built using Financial Network Analytics (FNA). Read more…
Verticalized Big Data solutions
General-purpose platforms can come across as hammers in search of nails
As much as I love talking about general-purpose big data platforms and data science frameworks, I’m the first to admit that many of the interesting startups I talk to are focused on specific verticals. At their core big data applications merge large amounts of real-time and static data to improve decision-making:
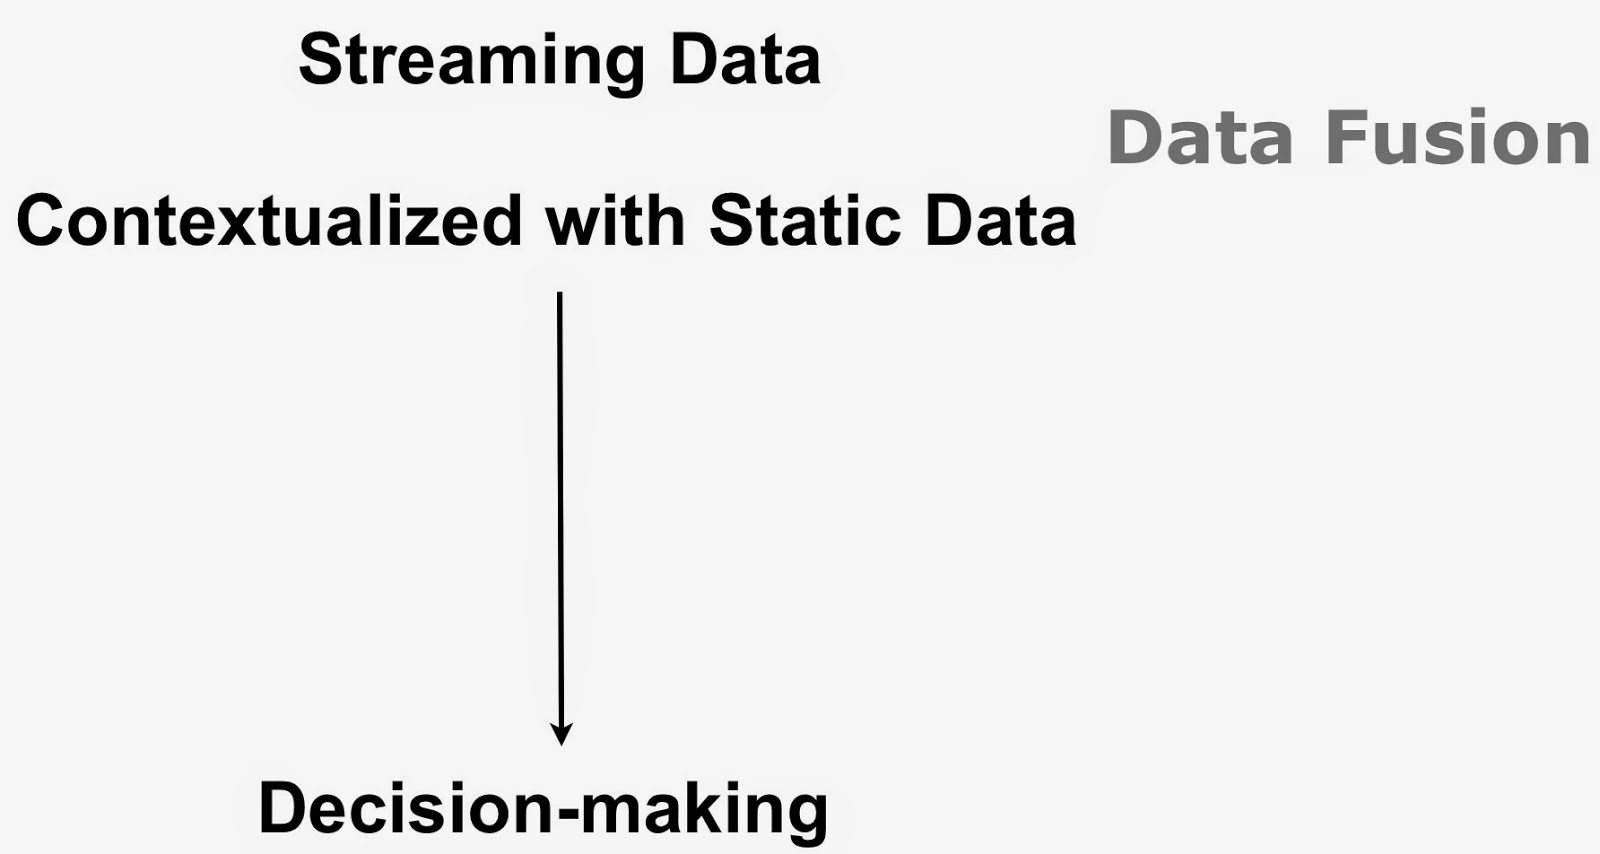
This simple idea can be hard to execute in practice (think volume, variety, velocity). Unlocking value from disparate data sources entails some familiarity with domain-specific1 data sources, requirements, and business problems.
It’s difficult enough to solve a specific problem, let alone a generic one. Consider the case of Guavus – a successful startup that builds big data solutions for the telecom industry (“communication service providers”). Its founder was very familiar with the data sources in telecom, and knew the types of applications that would resonate within that industry. Once they solve one set of problems for a telecom company (network optimization), they quickly leverage the same systems to solve others (marketing analytics).
This ability to address a variety of problems stems from Guavus’ deep familiarity with data and problems in telecom. In contrast, a typical general-purpose platform can come across as a hammer in search of a nail. So while I remain a fan (and user) of general-purpose platforms, the less well-known verticalized solutions are definitely on my radar.
Better tools can’t overcome poor analysis
I’m not suggesting that the criticisms raised against big data don’t apply to verticalized solutions. But many problems are due to poor analysis and not the underlying tools. A few of the more common criticisms arise from analyzing correlations: correlation is not causation, correlations are dynamic and can sometimes change drastically2, and data dredging3.
Related Content:
- The backlash against big data, continued
- The CFP for Strata New York + Hadoop World 2014 is now open!
- Strata Santa Clara 2014 Video Compilation
- Financial analytics as a service
(0) This post grew out of a recent conversation with Guavus founder, Anukool Lakhina.
(1) General-purpose platforms and components are helpful, but they usually need to be “tweaked” or “optimized” to solve problems in a variety of domains.
(2) When I started working as a quant at a hedge fund, traders always warned me that correlations jump to 1 during market panics.
(3) The best example comes from finance and involves the S&P 500 and butter production in Bangladesh.
5 Fun Facts about HBase that you didn’t know
HBase has made inroads in companies across many industries and countries
With HBaseCon right around the corner, I wanted to take stock of one of the more popular1 components in the Hadoop ecosystem. Over the last few years, many more companies have come to rely on HBase to run key products and services. The conference will showcase a wide variety of such examples, and highlight some of the new features that HBase developers have added over the past year. In the meantime here are some things2 you may not have known about HBase:
Many companies have had HBase in production for 3+ years: Large technology companies including Trend Micro, EBay, Yahoo! and Facebook, and analytics companies RocketFuel and Flurry depend on HBase for many mission-critical services.
There are many use cases beyond advertising: Examples include communications (Facebook messages, Xiaomi), security (Trend Micro), measurement (Nielsen), enterprise collaboration (Jive Software), digital media (OCLC), DNA matching (Ancestry.com), and machine data analysis (Box.com). In particular Nielsen uses HBase to track media consumption patterns and trends, mobile handset company Xiaomi uses Hbase for messaging and other consumer mobile services, and OCLC runs the world’s largest online database of library resources on HBase.
Flurry has the largest contiguous HBase cluster: Mobile analytics company Flurry has an HBase cluster with 1,200 nodes (replicating into another 1,200 node cluster). Flurry is planning to significantly expand their large HBase cluster in the near future.
Crowdsourcing Feature discovery
More than algorithms, companies gain access to models that incorporate ideas generated by teams of data scientists
Data scientists were among the earliest and most enthusiastic users of crowdsourcing services. Lukas Biewald noted in a recent talk that one of the reasons he started CrowdFlower was that as a data scientist he got frustrated with having to create training sets for many of the problems he faced. More recently, companies have been experimenting with active learning (humans1 take care of uncertain cases, models handle the routine ones). Along those lines, Adam Marcus described in detail how Locu uses Crowdsourcing services to perform structured extraction (converting semi/unstructured data into structured data).
Another area where crowdsourcing is popping up is feature engineering and feature discovery. Experienced data scientists will attest that generating features is as (if not more) important than choice of algorithm. Startup CrowdAnalytix uses public/open data sets to help companies enhance their analytic models. The company has access to several thousand data scientists spread across 50 countries and counts a major social network among its customers. Its current focus is on providing “enterprise risk quantification services to Fortune 1000 companies”.
CrowdAnalytix breaks up projects in two phases: feature engineering and modeling. During the feature engineering phase, data scientists are presented with a problem (independent variable(s)) and are asked to propose features (predictors) and brief explanations for why they might prove useful. A panel of judges evaluate2 features based on the accompanying evidence and explanations. Typically 100+ teams enter this phase of the project, and 30+ teams propose reasonable features.
Instrumenting collaboration tools used in data projects
Built-in audit trails can be useful for reproducing and debugging complex data analysis projects
As I noted in a previous post, model building is just one component of the analytic lifecycle. Many analytic projects result in models that get deployed in production environments. Moreover, companies are beginning to treat analytics as mission-critical software and have real-time dashboards to track model performance.
Once a model is deemed to be underperforming or misbehaving, diagnostic tools are needed to help determine appropriate fixes. It could well be models need to be revisited and updated, but there are instances when underlying data sources1 and data pipelines are what need to be fixed. Beyond the formal systems put in place specifically for monitoring analytic products, tools for reproducing data science workflows could come in handy.
Interface Languages and Feature Discovery
It's easier to "discover" features with tools that have broad coverage of the data science workflow
Here are a few more observations based on conversations I had during the just concluded Strata Santa Clara conference.
Interface languages: Python, R, SQL (and Scala)
This is a great time to be a data scientist or data engineer who relies on Python or R. For starters there are developer tools that simplify setup, package installation, and provide user interfaces designed to boost productivity (RStudio, Continuum, Enthought, Sense).
Increasingly, Python and R users can write the same code and run it against many different execution1 engines. Over time the interface languages will remain constant but the execution engines will evolve or even get replaced. Specifically there are now many tools that target Python and R users interested in implementations of algorithms that scale to large data sets (e.g., GraphLab, wise.io, Adatao, H20, Skytree, Revolution R). Interfaces for popular engines like Hadoop and Apache Spark are also available – PySpark users can access algorithms in MLlib, SparkR users can use existing R packages.
In addition many of these new frameworks go out of their way to ease the transition for Python and R users. wise.io “… bindings follow the Scikit-Learn conventions”, and as I noted in a recent post, with SFrames and Notebooks GraphLab, Inc. built components2 that are easy for Python users to learn.
Extending GraphLab to tables
The popular graph analytics framework extends its coverage of the data science workflow
GraphLab’s SFrame, an interesting and somewhat under-the-radar tool was unveiled1 at Strata Santa Clara. It is a disk-based, flat table representation that extends GraphLab to tabular data. With the addition of SFrame, users can leverage GraphLab’s many algorithms on data stored as either graphs or tables. More importantly SFrame increases GraphLab’s coverage of the data science workflow: it allows users with terabyte-sized datasets to clean their data and create new features directly within GraphLab (SFrame performance can scale linearly with the number of available cores).
The beta version of SFrame can read data from local disk, HDFS, S3 or a URL, and save to a human-readable .csv or a more efficient native format. Once an SFrame is created and saved to disk no reprocessing of the data is needed. Below is Python code that illustrates how to read a .csv file into SFrame, create a new data feature and save it to disk on S3: