"Big Data Tools and Pipelines" entries

Topic models: Past, present, and future
The O'Reilly Data Show Podcast: David Blei, co-creator of one of the most popular tools in text mining and machine learning.

I don’t remember when I first came across topic models, but I do remember being an early proponent of them in industry. I came to appreciate how useful they were for exploring and navigating large amounts of unstructured text, and was able to use them, with some success, in consulting projects. When an MCMC algorithm came out, I even cooked up a Java program that I came to rely on (up until Mallet came along).
I recently sat down with David Blei, co-author of the seminal paper on topic models, and who remains one of the leading researchers in the field. We talked about the origins of topic models, their applications, improvements to the underlying algorithms, and his new role in training data scientists at Columbia University.
Generating features for other machine learning tasks
Blei frequently interacts with companies that use ideas from his group’s research projects. He noted that people in industry frequently use topic models for “feature generation.” The added bonus is that topic models produce features that are easy to explain and interpret:
“You might analyze a bunch of New York Times articles for example, and there’ll be an article about sports and business, and you get a representation of that article that says this is an article and it’s about sports and business. Of course, the ideas of sports and business were also discovered by the algorithm, but that representation, it turns out, is also useful for prediction. My understanding when I speak to people at different startup companies and other more established companies is that a lot of technology companies are using topic modeling to generate this representation of documents in terms of the discovered topics, and then using that representation in other algorithms for things like classification or other things.”

Recent performance improvements in Apache Spark
The goal is to offer a single platform where users can get the best distributed algorithms for any data processing task.
2014 has been the most active year of Spark development to date, with major improvements across the entire engine. One particular area where it made great strides was performance: Spark set a new world record in 100TB sorting, beating the previous record held by Hadoop MapReduce by three times, using only one-tenth of the resources; it received a new SQL query engine with a state-of-the-art optimizer; and many of its built-in algorithms became five times faster. In this post, I’ll cover some of the technology behind these improvements as well as new performance work the Apache Spark developer community has done to speed up Spark.
Back in 2010, we at the AMPLab at UC Berkeley designed Spark for interactive queries and iterative algorithms, as these were two major use cases not well served by batch frameworks like MapReduce. As a result, early users were drawn to Spark because of the significant performance improvements in these workloads. However, performance optimization is a never-ending process, and as Spark’s use cases have grown, so have the areas looked at for further improvement. User feedback and detailed measurements helped the Apache Spark developer community to prioritize areas to work in. Starting with the core engine, I’ll cover some of the recent optimizations that have been made. Read more…

Processing frameworks for Hadoop
How to decide which framework is best for your particular use case.
Editor’s note: Mark Grover will be part of the team teaching the tutorial Architectural Considerations for Hadoop Applications at Strata + Hadoop World in San Jose. Visit the Strata + Hadoop World website for more information on the program.
Hadoop has become the de-facto platform for storing and processing large amounts of data and has found widespread applications. In the Hadoop ecosystem, you can store your data in one of the storage managers (for example, HDFS, HBase, Solr, etc.) and then use a processing framework to process the stored data. Hadoop first shipped with only one processing framework: MapReduce. Today, there are many other open source tools in the Hadoop ecosystem that can be used to process data in Hadoop; a few common tools include the following Apache projects: Hive, Pig, Spark, Cascading, Crunch, Tez, and Drill, along with Impala and Presto. Some of these frameworks are built on top of each other. For example, you can write queries in Hive that can run on MapReduce or Tez. Another example currently under development is the ability to run Hive queries on Spark.
Amidst all of these options, two key questions arise for Hadoop users:
- Which processing frameworks are most commonly used?
- How do I choose which framework(s) to use for my specific use case?
This post will you help answer both of these questions, giving you enough context to make an educated decision regarding the best processing framework for your specific use case. Read more…

A tale of two clusters: Mesos and YARN
With Myriad, analytics can be performed on the same hardware that runs your production services.
This is a tale of two siloed clusters. The first cluster is an Apache Hadoop cluster. This is an island whose resources are completely isolated to Hadoop and its processes. The second cluster is the description I give to all resources that are not a part of the Hadoop cluster. I break them up this way because Hadoop manages its own resources with Apache YARN (Yet Another Resource Negotiator). Which is nice for Hadoop, but all too often those resources are underutilized when there are no big data workloads in the queue. And then when a big data job comes in, those resources are stretched to the limit, and they are likely in need of more resources. That can be tough when you are on an island.
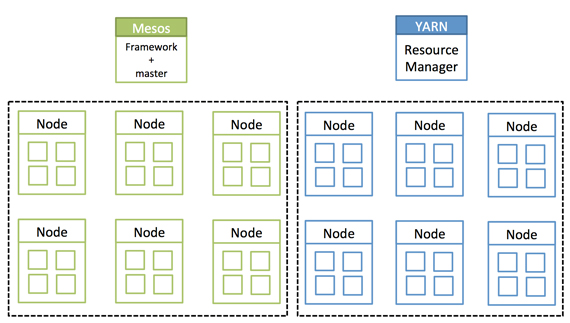
Isolated clusters. Source: Mesosphere and MapR, used with permission.
Hadoop was meant to tear down walls — albeit, data silo walls — but walls, nonetheless. What has happened is that while tearing some walls down, other types of walls have gone up in their place.
Another technology, Apache Mesos, is also meant to tear down walls — but Mesos has often been positioned to manage the “second cluster,” which are all of those other, non-Hadoop workloads.
This is where the story really starts, with these two silos of Mesos and YARN. They are often pitted against each other, as if they were incompatible. It turns out they work together, and therein lies my tale. Read more…

A million rows isn’t cool. You know what’s cool? A billion rows.
Changing your frame of reference when starting with SQL on Hadoop.
Editor’s note: John Russell will be one of the teachers of the tutorial Getting Started with Interactive SQL-On-Hadoop at Strata + Hadoop World in San Jose. Visit the Strata + Hadoop World website for more information on the program.
If you’re just getting started doing analytic work with SQL on Hadoop, a table with a million rows might seem like a good starting point for experimentation. Isn’t that a lot of data? While you can exercise the features of a traditional database with a million rows, for Hadoop it’s not nearly enough. Think billions of rows instead.
Let’s look at the ways a million-row table falls short. Understanding the data volumes involved with big data can help you avoid going down unproductive pathways based on misleading assumptions.
With a million-row table, every byte in each row represents a megabyte of total data volume. Let’s say your table represents people and has fields for name, address, occupation, salary, height, weight, number of children, and favorite food. Here’s what a sample field might look like, with a scale underneath to illustrate length:
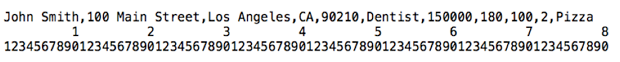
This particular record takes up 78 characters, including the comma separators. A back-of-the-envelope calculation suggests that, if this is an average row, we’ll end up with about 78 megabytes of data in the table. (And don’t recycle that envelope just yet — doing analytics with Hadoop, you’ll do a lot of rough estimates like this to sanity-check your expectations about performance and scalability.) Read more…

Improving on the Lambda Architecture for streaming analysis
Using fast, scalable relational databases to build event-oriented applications.
Modern organizations have started pushing their big data initiatives beyond historical analysis. Fast data creates big data, and applications are being developed that capture value, specifically real-time analytics, the moment fast data arrives. The need for real-time analysis of streaming data for real-time analytics, alerting, customer engagement or other on-the-spot decision-making, is converging on a layered software setup called the Lambda Architecture.
The Lambda Architecture, a collection of both big and fast data software components, is a software paradigm designed to capture value, specifically analytics, from not only historical data, but also from data that is streaming into the system.
In this article, I’ll explain the challenges that this architecture currently presents and explore some of the weaknesses. I’ll also discuss an alternative architecture using an in-memory database that can simplify and extend the capabilities of Lambda. Read more…

Getting started with data science in the cloud
Learn how to manipulate data, and construct and evaluate models in Azure ML, using a complete data science example.

Deriving value from machine learning, however, is often impeded by complex technology deployments and long model-development cycles. Fortunately, machine learning and data science are undergoing democratization. Workflow environments make tools for building and evaluating sophisticated machine learning models accessible to a wider range of users. Cloud-based environments provide secure ubiquitous access to data storage and powerful data science tools.
To get you started creating and evaluating your own machine learning models, O’Reilly has commissioned a new report: “Data Science in the Cloud, with Azure Machine Learning and R.” We use an in-depth data science example — predicting bicycle rental demand — to show you how to perform basic data science tasks, including data management, data transformation, machine learning, and model evaluation in the Microsoft Azure Machine Learning cloud environment. Using a free-tier Azure ML account, example R scripts, and the data provided, the report provides hands-on experience with this practical data science example. Read more…
The evolution of GraphLab
The O'Reilly Data Show Podcast: Carlos Guestrin on the early days of GraphLab and the evolution of GraphLab Create.
I only really started playing around with GraphLab when the companion project GraphChi came onto the scene. By then I’d heard from many avid users and admired how their user conference instantly became a popular San Francisco Bay Area data science event. For this podcast episode, I sat down with Carlos Guestrin, co-founder/CEO of Dato, a start-up launched by the creators of GraphLab. We talked about the early days of GraphLab, the evolution of GraphLab Create, and what’s he’s learned from starting a company.
MATLAB for graphs
Guestrin remains a professor of computer science at the University of Washington, and GraphLab originated when he was still a faculty member at Carnegie Mellon. GraphLab was built by avid MATLAB users who needed to do large scale graphical computations to demonstrate their research results. Guestrin shared some of the backstory:
“I was a professor at Carnegie Mellon for about eight years before I moved to Seattle. A couple of my students, Joey Gonzales and Yucheng Low were working on large scale distributed machine learning algorithms specially with things called graphical models. We tried to implement them to show off the theorems that we had proven. We tried to run those things on top of Hadoop and it was really slow. We ended up writing those algorithms on top of MPI which is a high performance computing library and it was just a pain. It took a long time and it was hard to reproduce the results and the impact it had on us is that writing papers became a pain. We wanted a system for my lab that allowed us to write more papers more quickly. That was the goal. In other words so they could implement this machine learning algorithms more easily, more quickly specifically on graph data which is what we focused on.”

It’s not just about Hadoop core anymore
For maximum business value, big data applications have to involve multiple Hadoop ecosystem components.
Data is deluging today’s enterprise organizations from ever-expanding sources and in ever-expanding formats. To gain insight from this valuable resource, organizations have been adopting Apache Hadoop with increasing momentum. Now, the most successful players in big data enterprise are no longer only utilizing Hadoop “core” (i.e., batch processing with MapReduce), but are moving toward analyzing and solving real-world problems using the broader set of tools in an enterprise data hub (often interactively) — including components such as Impala, Apache Spark, Apache Kafka, and Search. With this new focus on workload diversity comes an increased demand for developers who are well-versed in using a variety of components across the Hadoop ecosystem.
Due to the size and variety of the data we’re dealing with today, a single use case or tool — no matter how robust — can camouflage the full, game-changing potential of Hadoop in the enterprise. Rather, developing end-to-end applications that incorporate multiple tools from the Hadoop ecosystem, not just the Hadoop core, is the first step toward activating the disparate use cases and analytic capabilities of which an enterprise data hub is capable. Whereas MapReduce code primarily leverages Java skills, developers who want to work on full-scale big data engineering projects need to be able to work with multiple tools, often simultaneously. An authentic big data applications developer can ingest and transform data using Kite SDK, write SQL queries with Impala and Hive, and create an application GUI with Hue. Read more…

Now available: Big Data Now, 2014 edition
Our wrap-up of important developments in the big data field.

- Cognitive augmentation: As data processing and data analytics become more accessible, jobs that can be automated will go away. But to be clear, there are still many tasks where the combination of humans and machines produce superior results.
- Intelligence matters: Artificial intelligence is now playing a bigger and bigger role in everyone’s lives, from sorting our email to rerouting our morning commutes, from detecting fraud in financial markets to predicting dangerous chemical spills. The computing power and algorithmic building blocks to put AI to work have never been more accessible.