"Big Data Tools and Pipelines" entries

The log: The lifeblood of your data pipeline
Why every data pipeline should have a Unified Logging Layer.
The value of log data for business is unimpeachable. On every level of the organization, the question, “How are we doing?” is answered, ultimately, by log data. Error logs tell developers what went wrong in their applications. User event logs give product managers insights on usage. If the CEO has a question about the next quarter’s revenue forecast, the answer ultimately comes from payment/CRM logs. In this post, I explore the ideal frameworks for collecting and parsing logs.
Apache Kafka Architect Jay Kreps wrote a wonderfully crisp survey on log data. He begins with the simple question of “What is the log?” and elucidates its key role in thinking about data pipelines. Jay’s piece focuses mostly on storing and processing log data. Here, I focus on the steps before storing and processing.
Changing the way we think about log data
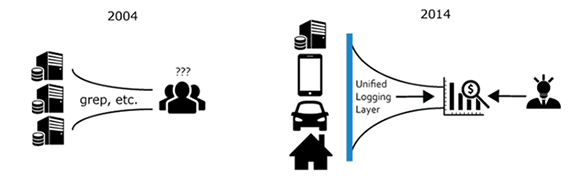
The old paradigm — machines to humans, and the new — machines to machines. Image courtesy of Kiyoto Tamura.
Over the last decade, the primary consumer of log data shifted from humans to machines.
Software engineers still read logs, especially when their software behaves in an unexpected manner. However, in terms of “bytes processed,” humans account for a tiny fraction of the total consumption. Much of today’s “big data” is some form of log data, and businesses run tens of thousands of servers to parse and mine these logs to gain competitive edge. Read more…

Investigating Spark’s performance
A deep dive into performance bottlenecks with Spark PMC member Kay Ousterhout.
 For many who use and deploy Apache Spark, knowing how to find critical bottlenecks is extremely important. In a recent O’Reilly webcast, Making Sense of Spark Performance, Spark committer and PMC member Kay Ousterhout gave a brief overview of how Spark works, and dove into how she measured performance bottlenecks using new metrics, including block-time analysis. Ousterhout walked through high-level takeaways from her in-depth analysis of several workloads, and offered a live demo of a new performance analysis tool and explained how you can use it to improve your Spark performance.
Her research uncovered surprising insights into Spark’s performance on two benchmarks (TPC-DS and the Big Data Benchmark), and one production workload. As part of our overall series of webcasts on big data, data science, and engineering, this webcast debunked commonly held ideas surrounding network performance, showing that CPU — not I/O — is often a critical bottleneck, and demonstrated how to identify and fix stragglers.
Network performance is almost irrelevant
While there’s been a lot of research work on performance — mainly surrounding the issues of whether to cache input data in-memory or on machine, scheduling, straggler tasks, and network performance — there haven’t been comprehensive studies into what’s most important to performance overall. This is where Ousterhout’s research comes in — taking on what she refers to as “community dogma,” beginning with the idea that network and disk I/O are major bottlenecks. Read more…

A real-time processing revival
Things are moving fast in the stream processing world.

Register for Strata + Hadoop World, London. Editor’s note: Ben Lorica is an advisor to Databricks and Graphistry. Many of the technologies discussed in this post will be covered in trainings, tutorials, and sessions at Strata + Hadoop World in London this coming May.
There’s renewed interest in stream processing and analytics. I write this based on some data points (attendance in webcasts and conference sessions; a recent meetup), and many conversations with technologists, startup founders, and investors. Certainly, applications are driving this recent resurgence. I’ve written previously about systems that come from IT operations as well as how the rise of cheap sensors are producing stream mining solutions from wearables (mostly health-related apps) and the IoT (consumer, industrial, and municipal settings). In this post, I’ll provide a short update on some of the systems that are being built to handle large amounts of event data.
Apache projects (Kafka, Storm, Spark Streaming, Flume) continue to be popular components in stream processing stacks (I’m not yet hearing much about Samza). Over the past year, many more engineers started deploying Kafka alongside one of the two leading distributed stream processing frameworks (Storm or Spark Streaming). Among the major Hadoop vendors, Hortonworks has been promoting Storm, Cloudera supports Spark Streaming, and MapR supports both. Kafka is a high-throughput distributed pub/sub system that provides a layer of indirection between “producers” that write to it and “consumers” that take data out of it. A new startup (Confluent) founded by the creators of Kafka should further accelerate the development of this already very popular system. Apache Flume is used to collect, aggregate, and move large amounts of streaming data, and is frequently used with Kafka (Flafka or Flume + Kafka). Spark Streaming continues to be one of the more popular components within the Spark ecosystem, and its creators have been adding features at a rapid pace (most recently Kafka integration, a Python API, and zero data loss). Read more…

Entities move data from tables to knowledge
Cleaning and combining fields can turn messy data into actionable insight.

We often talk in business and computing about moving from “raw data” to “knowledge,” hoping to take useful actions based on the data our organization has collected over time. Before one can view trends in your data or do other analytics, you need tools for data cleaning and for combining multiple data sources into meaningful collections of information, known as entities. An entity may be a customer, a product, a point of sale, an incident being investigated by the police, or anything else around which you want to build meaningful context.
In this post, we’ll explore some of the complexities in real-life data that create headaches — and how analytical software can help users prepare data for sophisticated queries and visualizations. Read more…

Telling your data’s story
How storytelling can enhance the effectiveness of your visualizations.
Editor’s note: this post is part of our investigation into Big Data Design and Social Science. Michael Freeman covers the use of storytelling frameworks in visualizations in his new tutorial video “Using Storytelling to Effectively Communicate Data.”
Visualizing complex relationships in big data often requires involved graphical displays that can be intimidating to users. As the volume and complexity of data collection and storage scale exponentially, creating clear, communicative, and approachable visual representations of that data is an increasing challenge. As a data visualization specialist, I frightened one of my first sets of collaborators when I suggested using this display:
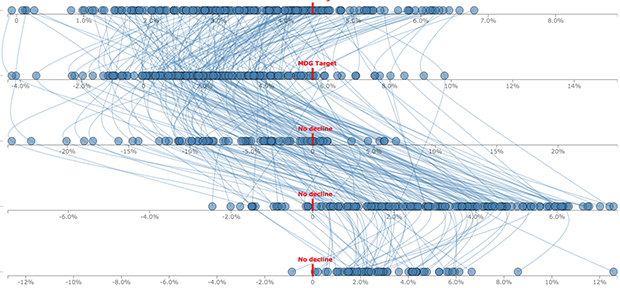
What I had failed to communicate was that we would use a story structure to introduce audiences to the complex layout (you can see how I did it here).
This image captures three emerging limitations in big data visualization:
- Unclear visual encodings: People don’t know what each visual symbol represents
- Too much data: The volume of information displayed is overwhelming
- Too many variables: Simultaneous encodings of color, position, size, etc. precludes fully understanding each dimension
Redefining power distribution using big data
The O'Reilly Data Show Podcast: Erich Nachbar on testing and deploying open source, distributed computing components.
 When I first hear of a new open source project that might help me solve a problem, the first thing I do is ask around to see if any of my friends have tested it. Sometimes, however, the early descriptions sound so promising that I just jump right in and try it myself — and in a few cases, I transition immediately (this was certainly the case for Spark).
I recently had a conversation with Erich Nachbar, founder and CTO of Virtual Power Systems, and one of the earliest adopters of Spark. In the early days of Spark, Nachbar was CTO of Quantifind, a startup often cited by the creators of Spark as one of the first “production deployments.” On the latest episode of the O’Reilly Data Show Podcast, we talk about the ease with which Nachbar integrates new open source components into existing infrastructure, his contributions to Mesos, and his new “software-defined power distribution” startup.
Ecosystem of open source big data technologies
When evaluating a new software component, nothing beats testing it against workloads that mimic your own. Nachbar has had the luxury of working in organizations where introducing new components isn’t subject to multiple levels of decision-making. But, as he notes, everything starts with testing things for yourself:
“I have sort of my mini test suite…If it’s a data store, I would just essentially hook it up to something that’s readily available, some feed like a Twitter fire hose, and then just let it be bombarded with data, and by now, it’s my simple benchmark to know what is acceptable and what isn’t for the machine…I think if more people, instead of reading papers and paying people to tell them how good or bad things are, would actually set aside a day and try it, I think they would learn a lot more about the system than just reading about it and theorizing about the system. Read more…
Let’s build open source tensor libraries for data science
Tensor methods for machine learning are fast, accurate, and scalable, but we'll need well-developed libraries.

Data scientists frequently find themselves dealing with high-dimensional feature spaces. As an example, text mining usually involves vocabularies comprised of 10,000+ different words. Many analytic problems involve linear algebra, particularly 2D matrix factorization techniques, for which several open source implementations are available. Anyone working on implementing machine learning algorithms ends up needing a good library for matrix analysis and operations.
But why stop at 2D representations? In a recent Strata + Hadoop World San Jose presentation, UC Irvine professor Anima Anandkumar described how techniques developed for higher-dimensional arrays can be applied to machine learning. Tensors are generalizations of matrices that let you look beyond pairwise relationships to higher-dimensional models (a matrix is a second-order tensor). For instance, one can examine patterns between any three (or more) dimensions in data sets. In a text mining application, this leads to models that incorporate the co-occurrence of three or more words, and in social networks, you can use tensors to encode arbitrary degrees of influence (e.g., “friend of friend of friend” of a user).
Being able to capture higher-order relationships proves to be quite useful. In her talk, Anandkumar described applications to latent variable models — including text mining (topic models), information science (social network analysis), recommender systems, and deep neural networks. A natural entry point for applications is to look at generalizations of matrix (2D) techniques to higher-dimensional arrays. Read more…

Navigating the Hadoop ecosystem
A field guide to the Apache Hadoop projects, subprojects, and related technologies.
Marshall Presser, co-author of Field Guide to Hadoop, contributed to this post.
IT managers, developers, data analysts, and system architects are encountering the largest and most disruptive change in data analysis since the ascendency of the relational database in early 1980s — the challenge to process, organize, and take full advantage of big data. With 73% of organizations making big data investments in 2014 and 2015, this transition is occurring at a historic pace, requiring new ways of thinking to go along with new tools and techniques.
Hadoop is the cornerstone of this change to a landscape of systems and skills we’ve traditionally possessed. In the nine short years since the project revolutionized data science at Yahoo!, an entire ecosystem of technologies has sprung up around it. While the power of this ecosystem is plain to see, it can be a challenge to navigate your way through the complex and rapidly evolving collection of projects and products.
A couple years ago, my coworker Marshall Presser and I started our journey into the world of Hadoop. Like many folks, we found the company we worked for was making a major investment in the Hadoop ecosystem, and we had to find a way to adapt. We started in all of the typical places — blog posts, trade publications, Wikipedia articles, and project documentation. Quickly, we learned that many of these sources are often highly biased, either too shallow or too deep, and just plain inconsistent. Read more…
Marshal your data with entity resolution
Analytics can make combining or comparing data faster and less painful.
 Entity resolution refers to processes that businesses and other organizations have to do all the time in order to produce full reports on people, organizations, or events. Entity resolution can be used, for instance, to:
- Combine your customer data with a list purchased from a data broker. Identical data may be in columns of different names, such as “last” and “surname.” Connecting columns from different databases is a common extract, transform, and load (ETL) task.
- Extract values from one database and match them against one or more columns in another. For instance, if you get a party list, you might want to find your clients among the attendees. A police detective might want to extract the names of people involved in a crime report and see whether any suspects are among them.
- Find a match in dirty data, such as a person whose name is spelled differently in different rows.
Dirty, inconsistent, or unstructured data is the chief challenge in entity resolution. Jenn Reed, director of product management for Novetta Entity Analytics, points out that it’s easy for two numbers to get switched, such as a person’s driver’s license and social security numbers. Over time, sophisticated rules have been created to compare data, and it often requires the comparison of several fields to make sure a match is correct. (For instance, health information exchanges use up to 17 different types of data to make sure the Marcia Marquez who just got admitted to the ER is the same Marcia Marquez who visited her doctor last week.) Read more…

Startup Showcase winners reflect the data industry’s maturity
The Strata + Hadoop World 2015 Startup Showcase highlighted four important trends in the big data world.
At Strata + Hadoop World 2015 in San Jose last week, we ran an event for data-driven startups. This is the fourth year for the Startup Showcase, and it’s become a fixture of the conference. One of our early winners, MemSQL, has since raised $50 million in financing, and it’s a good way for companies to get visibility with investors, analysts, and attendees.
This year’s winners underscore several important trends in the big data space at the moment: the maturity of management tools; the deployment of machine learning in other verticals; an increased focus on privacy and permissions; and the convergence of enterprise languages like SQL with distributed, schema-less data stacks. Read more…