
The recent violence in the U.K. has led some in the British government to propose banning people from social networks during times of civic unrest. Prime Minister David Cameron told an emergency session of Parliament:
Everyone watching these horrific actions will be struck by how they were organised via social media. We are working with the police, the intelligence services and industry to look at whether it would be right to stop people communicating via these websites and services when we know they are plotting violence, disorder and criminality.
But The Guardian has analyzed some 2.5 million tweets relating to the events in the U.K., and the newspaper’s findings challenge the government’s contention that Twitter and other social networks were used to organize violence.
More than 206,000 tweets — about 8% of the total — focused on coordinating clean-up efforts following the rioting and looting.
In the interactive visualization, you can see the relationship in the various communities where outbreaks of violence occurred between the events themselves and the surge of Twitter activity. In the majority of cases, Twitter activity increased after, not before, the violence.
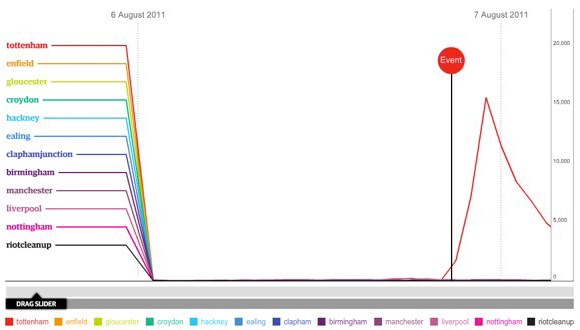
Twitter traffic during U.K. riots. Click to see the full interactive visualization
The Guardian says it will continue to examine this database in the coming weeks, just as the British government continues its inquiries into the relationship between social media and violence.
Found a great visualization? Tell us about it
This post is part of an ongoing series exploring visualizations. We’re always looking for leads, so please drop a line if there’s a visualization you think we should know about.
 Strata Conference New York 2011, being held Sept. 22-23, covers the latest and best tools and technologies for data science — from gathering, cleaning, analyzing, and storing data to communicating data intelligence effectively.
More Visualizations: